Fig. 10
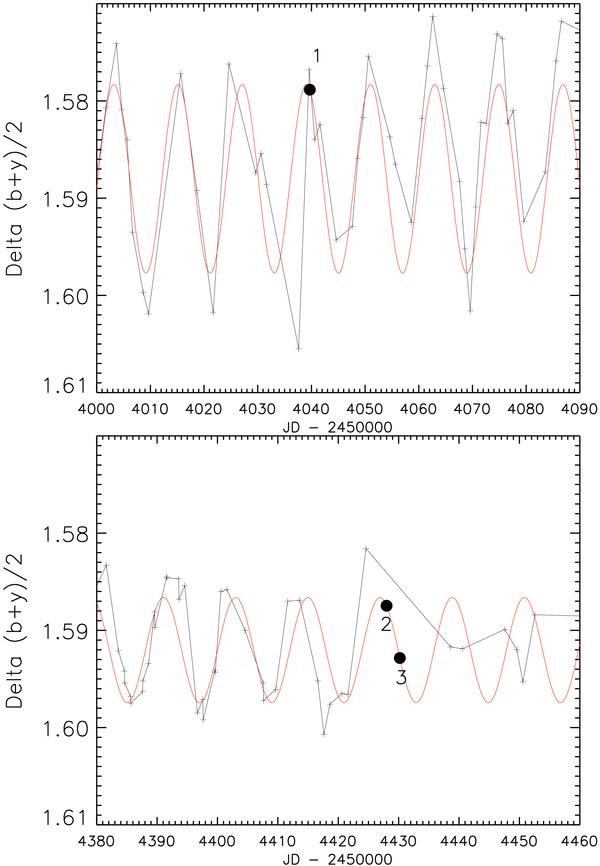
(Top) a): relative flux variation for HD 189733 observed with ground-based follow-up encompassing the time of our IRAC observations (connected crosses). The black circular spot indicates the time of our Spitzer stellar mode observations at 3.6 and 5.8 μm (visit 1). The variations are caused by rotational modulation in the visibility of star spots with a rotation period of 11.953 days (Henry & Winn 2008). The continuous curve overplotted in red corresponds to a sinusoid with a period of 11.95 days. (Bottom) b): the same as above for the stellar mode observations at 4.5 and 8.0 μm (visit 2) and subarray mode observations at 3.6 μm (visit 3).
Current usage metrics show cumulative count of Article Views (full-text article views including HTML views, PDF and ePub downloads, according to the available data) and Abstracts Views on Vision4Press platform.
Data correspond to usage on the plateform after 2015. The current usage metrics is available 48-96 hours after online publication and is updated daily on week days.
Initial download of the metrics may take a while.