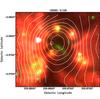
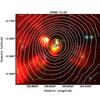
Fig. 7
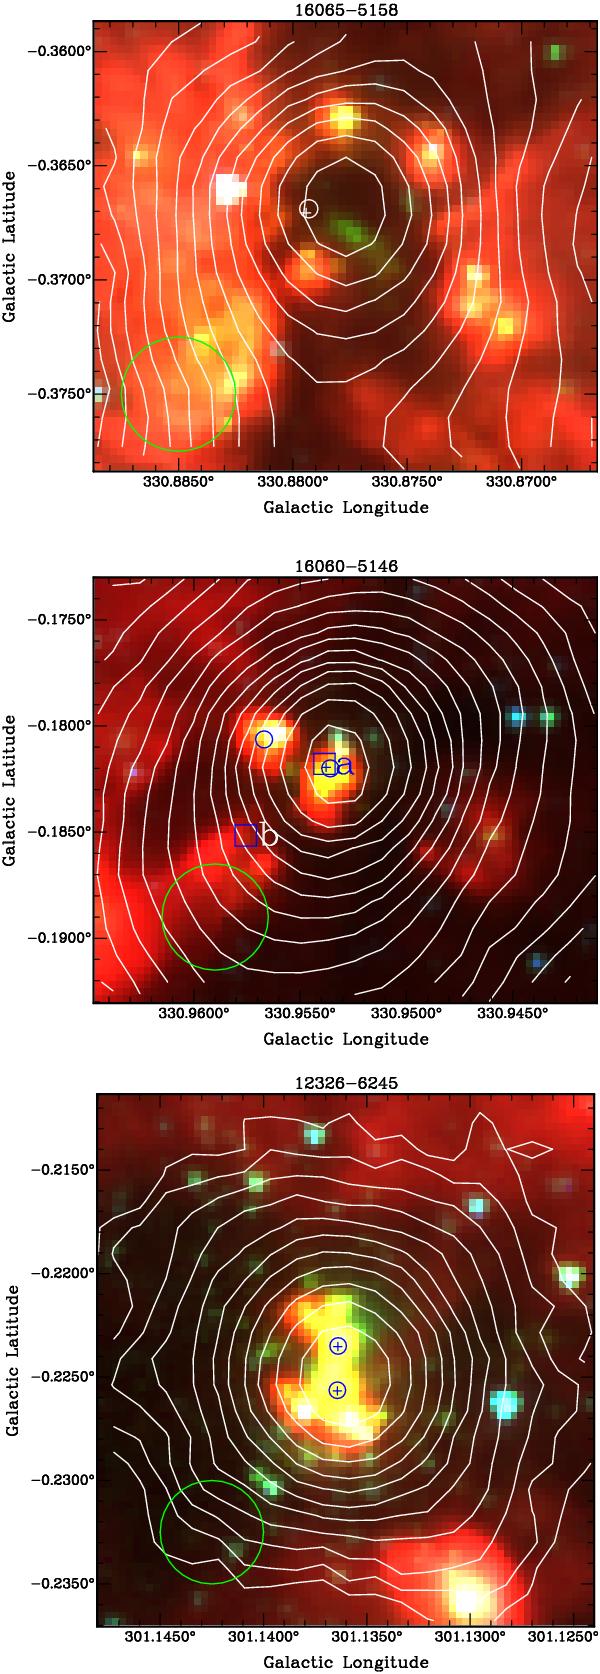
Zoom-in of the Spitzer GLIMPSE composite image of 3.6, 4.5 and 8 μm emission. LABOCA 870 μm emission is shown as contours, starting from 5σ. The small blue circles and crosses mark the position of the 6 cm and 3.6 cm continuum (Urquhart et al. 2007). 16060–5146: the blue boxes show the location of the ATCA 3 mm continuum emission (marked “a” and “b”). 16065−5158: the cross and circle marking the radio continuum emission are shown in white.
Current usage metrics show cumulative count of Article Views (full-text article views including HTML views, PDF and ePub downloads, according to the available data) and Abstracts Views on Vision4Press platform.
Data correspond to usage on the plateform after 2015. The current usage metrics is available 48-96 hours after online publication and is updated daily on week days.
Initial download of the metrics may take a while.