Free Access
Fig. 3
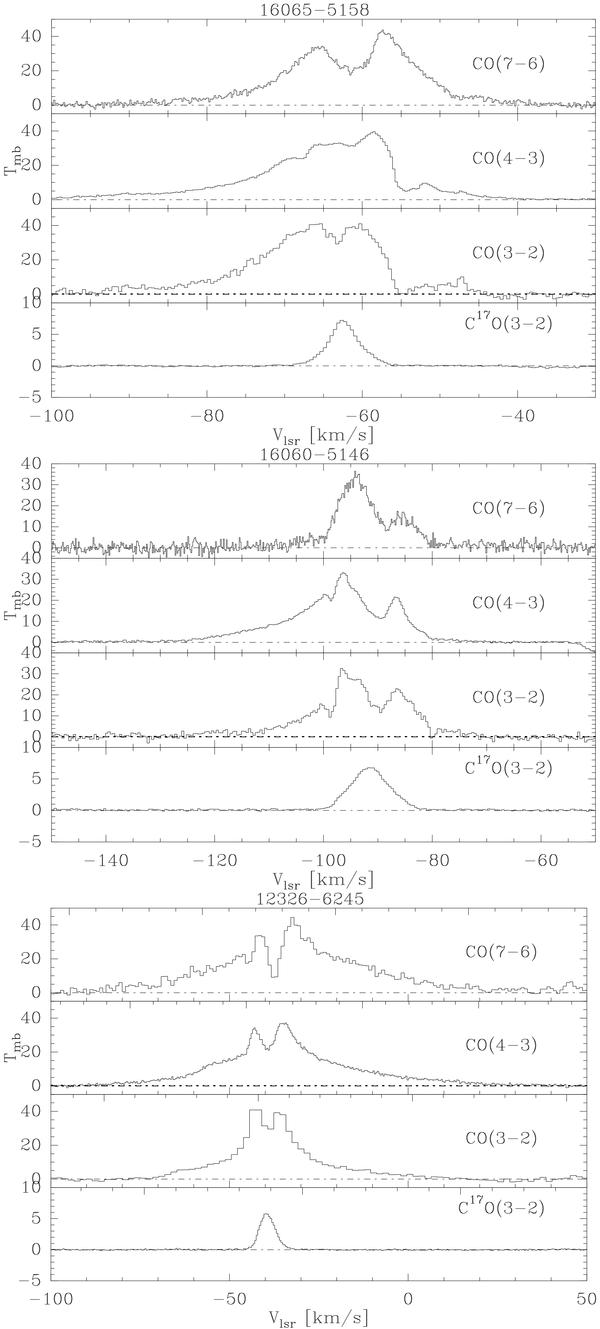
C17O(3−2), CO(3−2), CO(4−3) and CO(7−6) transitions. While C17O (3−2) is observed on the peak positions in 16065−5158 (top), 16060−5146 (middle) and 12326−6245 (bottom), the spectra of the remaining transitions were produced by averaging all the spectra taken at the map positions. The dashed line marks the zero level.
This figure is made of several images, please see below:


Current usage metrics show cumulative count of Article Views (full-text article views including HTML views, PDF and ePub downloads, according to the available data) and Abstracts Views on Vision4Press platform.
Data correspond to usage on the plateform after 2015. The current usage metrics is available 48-96 hours after online publication and is updated daily on week days.
Initial download of the metrics may take a while.