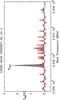
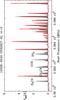
Fig. 16
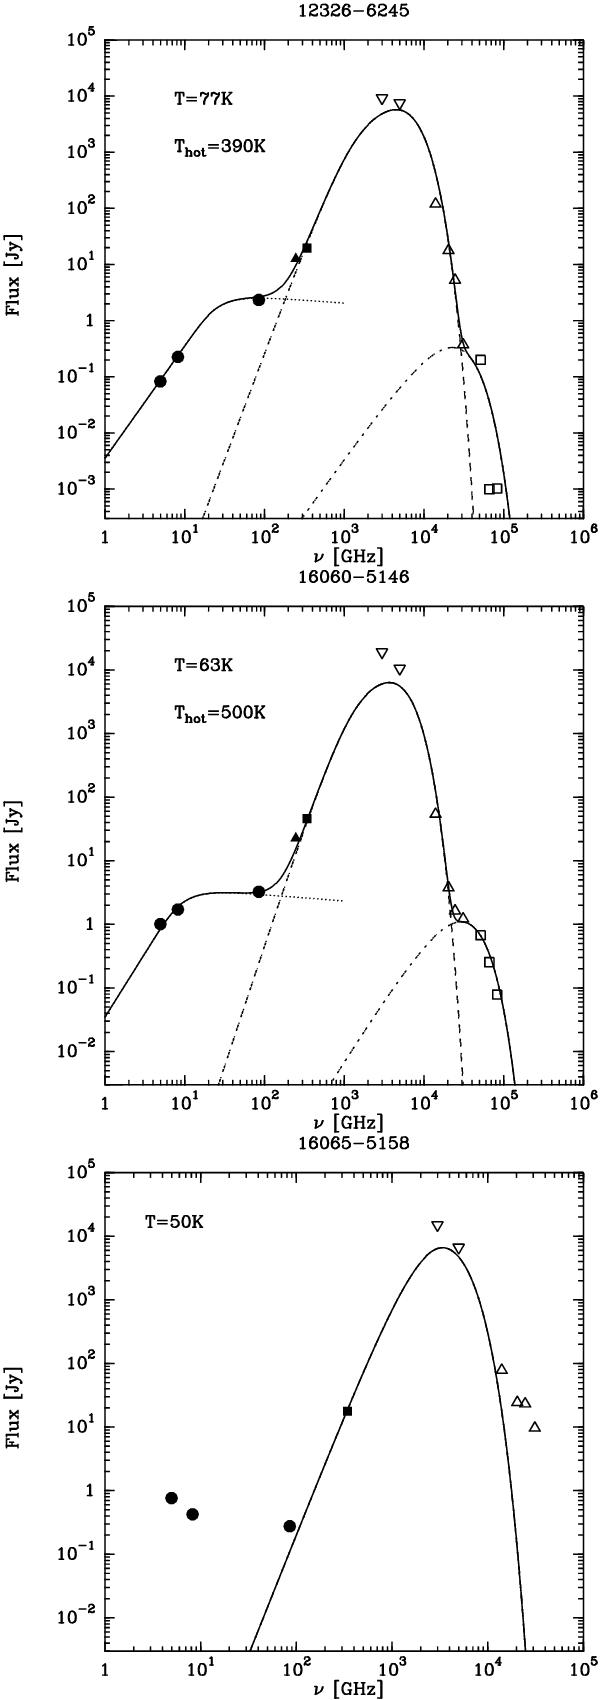
Spectral energy distributions for the three sources. The IRAS fluxes (downward pointing triangles) are taken from the high-resolution IRAS Galaxy Atlas (IGA) data. The empty squares and triangles show the MSX and Spitzer GLIMPSE fluxes respectively, the filled circles the ATCA fluxes and the filled triangle and square the bolometer fluxes from SIMBA and LABOCA.
Current usage metrics show cumulative count of Article Views (full-text article views including HTML views, PDF and ePub downloads, according to the available data) and Abstracts Views on Vision4Press platform.
Data correspond to usage on the plateform after 2015. The current usage metrics is available 48-96 hours after online publication and is updated daily on week days.
Initial download of the metrics may take a while.