Free Access
Fig. 1
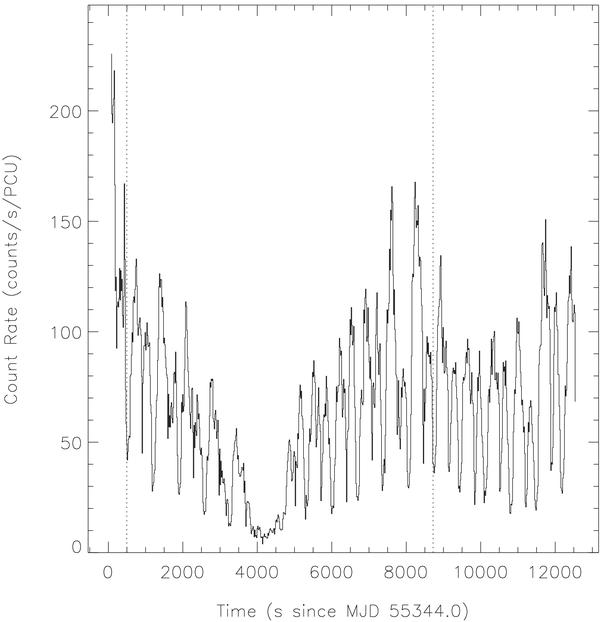
Light curve of RXTE/PCA observations of GX 301–2 on 2010 May 28 (ObsID: 95354-03-03-00) in the 3−25 keV range. The vertical dotted lines indicate the time interval of detailed temporal and spectral investigations presented in Sect. 3.
Current usage metrics show cumulative count of Article Views (full-text article views including HTML views, PDF and ePub downloads, according to the available data) and Abstracts Views on Vision4Press platform.
Data correspond to usage on the plateform after 2015. The current usage metrics is available 48-96 hours after online publication and is updated daily on week days.
Initial download of the metrics may take a while.