Free Access
Fig. 2
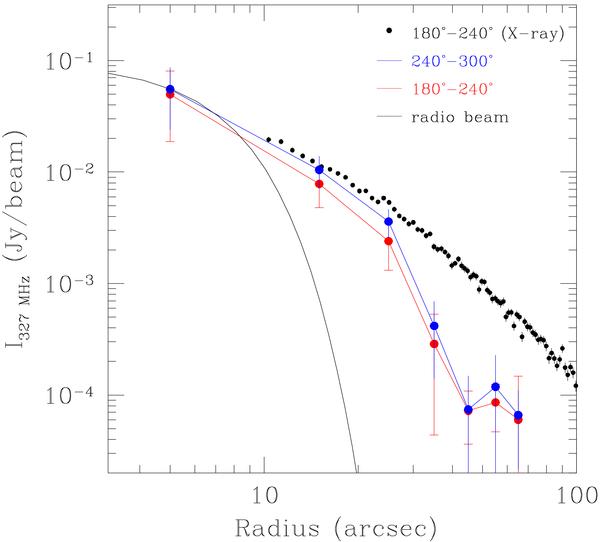
327 MHz brightness profiles (blue and red) extracted in sectors shown in Fig. 1 (right), centered on the radio peak. Comparison with the radio beam (black curve) clearly shows that the minihalo emission is extended. Black dots show the X-ray brightness profile in the same combined sector.
Current usage metrics show cumulative count of Article Views (full-text article views including HTML views, PDF and ePub downloads, according to the available data) and Abstracts Views on Vision4Press platform.
Data correspond to usage on the plateform after 2015. The current usage metrics is available 48-96 hours after online publication and is updated daily on week days.
Initial download of the metrics may take a while.