Fig. 1
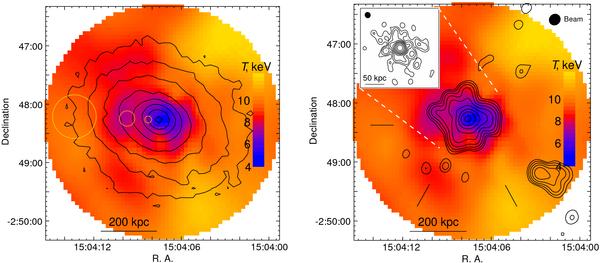
Left: Chandra gas temperature map (color); contours overlay the 0.8–4 keV Chandra X-ray image smoothed with a σ = 2′′ Gaussian. Contours are spaced by a factor of 2 in surface brightness. The radii of three circles illustrate the variable smoothing width (Gaussian σ) used for the temperature map. The rms temperature uncertainties at their positions (from small to large radius) are 0.3 keV, 0.5 keV, and 0.9 keV. Right: GMRT 327 MHz contours of the minihalo overlaid on the gas temperature map. The radio beam is 11.3′′ × 10.4′′. Contours are spaced by a factor of 2, starting from + 3σ = 0.3 mJy beam-1. Dashes show sectors used for radial profiles (Fig. 2). Inset: VLA 1.46 GHz pointed-observation image at resolution 4′′ × 4′′. Contours start at 0.1 mJy beam-1 and scale by factor of 2. Black ellipses show beam sizes of the two radio images.
Current usage metrics show cumulative count of Article Views (full-text article views including HTML views, PDF and ePub downloads, according to the available data) and Abstracts Views on Vision4Press platform.
Data correspond to usage on the plateform after 2015. The current usage metrics is available 48-96 hours after online publication and is updated daily on week days.
Initial download of the metrics may take a while.