| Issue |
A&A
Volume 525, January 2011
|
|
|---|---|---|
| Article Number | L3 | |
| Number of page(s) | 5 | |
| Section | Letters | |
| DOI | https://doi.org/10.1051/0004-6361/201015822 | |
| Published online | 30 November 2010 | |
Letter to the Editor
The formation of a thick disk through the heating of a thin disk: Agreement with orbital eccentricities of stars in the solar neighborhood
GEPI, Observatoire de Paris, CNRS, Université Paris Diderot,
5 place Jules Janssen,
92190
Meudon, France
e-mail: This email address is being protected from spambots. You need JavaScript enabled to view it.
Received:
26
September
2010
Accepted:
13
November
2010
Abstract
We study the distribution of orbital eccentricities of stars in thick disks generated by the heating of a pre-existing thin stellar disk through a minor merger (mass ratio 1:10), using N-body/SPH numerical simulations of interactions that span a range of gas fractions in the primary disk and initial orbital configurations. The resulting eccentricity distributions have an approximately triangular shape, with a peak at 0.2−0.35, and a relatively smooth decline towards higher values. Stars originally in the satellite galaxy tend to have higher eccentricities (on average from e = 0.45 to e = 0.75), which is in general agreement with the models of Sales and collaborators, although in detail we find fewer stars with extreme values and no evidence of their secondary peak around e = 0.8. The absence of this high-eccentricity feature results in a distribution that qualitatively matches the observations. Moreover, the increase in the orbital eccentricities of stars in the solar neighborhood with vertical distance from the Galactic mid-plane found by Dierickx and collaborators can be qualitatively reproduced by our models, but only if the satellite is accreted onto a direct orbit. We thus speculate that if minor mergers were the dominant means of forming the Milky Way thick disk, the primary mechanism should be merging with satellite(s) on direct orbits.
Key words: Galaxy: formation / Galaxy: evolution / Galaxy: structure / Galaxy: kinematics and dynamics / solar neighborhood
© ESO, 2010
1. Introduction
Sales et al. (2009) proposed using the orbital eccentricity of stars in a thick disk as a way of constraining the main physical mechanism responsible for its formation. They pointed out the distinctive differences between the eccentricity distributions predicted for a comprehensive range of formation mechanisms for the thick disk; the four mechanisms they considered were: the heating of a pre-existing thin disk by a varying gravitational potential in the thin disk, which causes radial migration and a thickening of the stellar disk (Roškar et al. 2008a); heating of a pre-existing thin disk by minor mergers (Villalobos & Helmi 2008); accretion of disrupted satellites (Abadi et al. 2003); and formation by gas-rich mergers (Brook et al. 2004, 2005). Their results can be summarized as: (1) the accretion scenario predicts a broad distribution of stellar eccentricities, e, which are quite symmetric with respect to its peak at around e = 0.5; (2) the radial migration scenario produces a thick disk whose stars have eccentricities peaking around e = 0.25−0.3, and whose distribution is quite narrow and symmetric around its peak; (3) the heating of a pre-existing thin disk by a 1:5 mass ratio merger produces a distribution with a peak around e = 0.25, with a secondary peak and tail at high eccentricities composed mostly of stars originally in the satellite galaxy; and (4) gas-rich mergers produce a result quite similar to the previous scenario, except for the absence of the secondary peak. The strength of this work is that it considers a number of scenarios for the formation of the thick disk – each of which apparently produces a unique (and testable) signature.
A comparison of the eccentricity distributions predicted by these four models with that of stars populating the thick disk in the solar neighborhood led Dierickx et al. (2010) to reject the above-mentioned models (1), (2), and (3), which leads them to propose gas-rich mergers at early epochs as the most probable mechanism for the formation of the Galactic thick disk. Similarly, Wilson et al. (2010) found that the eccentricity distribution of a sample of solar neighborhood thick disk stars from RAVE survey data appears to be most consistent with the gas-rich merger scenario. Within the limitations of any of these comparisons, their conclusions appear well justified. However, the question arises of whether this is the complete story.
To make this comparison based on a comprehensive analysis of the effects of minor mergers, a wide range of initial orbital parameters needs to be considered in numerical simulations. The aim of this Letter is to compare the observed distribution of the eccentricities of thick disk stars in the solar neighborhood with those predicted by twelve 1:10 minor mergers simulations, with and without gas in the primary, i.e., the most massive galaxy, and in the satellite, that have a range of initial orbital characteristics.
2. Models
The simulations we analyzed are part of a set of minor merger simulations with a mass ratio of 1:10, described extensively in Chilingarian et al. (2010). The primary and the satellite galaxy each consist of a spherical non-rotating halo and a central bulge, both modeled as Plummer spheres, and a stellar and an optional gas disk represented by Myamoto-Nagai density profiles. Both the primary and the satellite galaxies span a range of morphologies, with bulge-to-disk mass ratios of between 0.2 and 0.25 and gas-to-stellar disk fractions, fgas, from 0 to 0.2. We analyzed twelve of the encounters labeled gS0dS0, gSadSa, and gSbdSb in Chilingarian et al. (2010) containing, respectively, fgas = 0, 0.1, and 0.2. A total of NTOT = 528000 particles were used in all simulations, distributed between the primary galaxy and the satellite. We tested the dependence of the results on the number of particles used by running an additional simulation with 2.5 times more particles, NTOT = 1320000. After the particles in each simulation had relaxed, the two galaxies were placed at an initial distance of 100 kpc, with a variety of initial relative velocities (id = 01dir, 01ret, 02dir, 02ret in Table 9 of Chilingarian et al. 2010), to simulate different orbits. For a complete description of the initial galaxy models, the number of particles employed, and the orbital characteristics, we refer the reader to Tables 1, 3, 6, and 9 of Chilingarian et al. (2010).
All simulations were run using the Tree-SPH code described in Semelin & Combes (2002). The gas is assumed to be isothermal at a temperature of 104 K. Prescriptions for star formation and feedback from supernovae explosions are also included. The equations of motion are integrated using a leap-frog algorithm, with a fixed time step of 0.5 Myr. For the evaluation of the gravitational forces, a softening length ϵ = 200 pc (or ϵ = 150 pc for the high-resolution simulation) is employed. With these choices, the relative error in the conservation of the total energy is about 10-6 per time step.
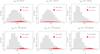 |
Fig. 1 Eccentricity distribution of stellar particles in a number of 1:10 minor mergers within a cylindrical shell at disk scale lengths, Rd, from 2 ≤ R/Rd ≤ 3, and at heights, z0, from 1 ≤ z/z0 ≤ 3. From left to right: the gas-to-stellar disk mass fraction increases from fgas = 0, 0.1, and 0.2 in each panel. Mergers on direct orbits are shown in the top row, ones on retrograde orbits are shown in the panels of the bottom row. We indicated both the contribution of stars initially in the satellite galaxy (red histogram) and the distribution of all the stars (grey histograms). The dashed histogram in the upper-left panel corresponds to a high-resolution simulation, employing a total of 1320000 particles and a softening length ϵ = 150 pc. The results of the higher resolution simulation are in qualitatively in agreement with those of the lower resolutions simulations. |
3. Results and discussion
We analyzed the resulting eccentricities from the orbits of the stellar particles in our modeled galaxies during the period 1−2 Gyr after the completion of the merger. This is sufficient for the orbits to be relatively stable. For each particle, we computed the minimal (rmin) and maximal distance (rmax) from the galaxy center during this period of time, and defined the eccentricity as e = (rmax − rmin)/(rmax + rmin). As done in Sales et al. (2009), we restricted our analysis to a cylindrical region around the galaxy center, at 2 ≤ R/Rd ≤ 3 and 1≤|z/z0|≤ 3, where R/Rd and z/z0 are the cylindrical coordinates of a star relative to the disk scale-length and the scale height of the thick disk. The disk scale-length varies slightly from one model to another, depending mostly on the gas fraction in the primary disk, ranging from Rd = 4.3 to Rd = 5.4 kpc. The average value of the thick disk scale-height in the volume under consideration is z0 = 2 kpc (fitted with an exponential), whereas the exact value depends on both the gas fraction of the primary and the initial orbital configuration (Qu et al. 2010).
For a representative set of models, the resulting distributions of orbital eccentricities of the old stars1 in the remnant galaxy are shown in Fig. 1. Independent of the exact properties of the galaxies in the simulations and of the initial orbital configurations, a number of common features emerge from the simulations:
-
the overall distribution of eccentricities shows a peak at low values, between e = 0.2−0.35, followed by a relatively smooth decrease towards higher values;
-
stars initially in the satellite galaxy span a wide range of eccentricities, from e = 0.45 to e = 0.75, with the exact values depending on the orbital characteristics and gas fractions;
-
we never find a secondary peak at high eccentricities, similar to that between 0.7 and 0.95 reported in Sales et al. (2009).
In principle, many parameters can contribute to this difference. The mass ratio of the encounters is different, for example: we analyze 1:10 mergers, whereas Sales et al. (2009) considered a 1:5 ratio. A relatively more massive satellite would lead to a greater fractional contribution of its stars to the total mass in the thick disk at a given height above the galaxy mid-plane. To investigate the impact of a more massive accretion event, we analyzed the case of a primary galaxy accreting consecutively two satellites2, each having a mass that is one tenth of the mass of the primary galaxy. In this case, the total mass acquired through the two minor mergers is equivalent to that acquired in a single merger of mass 1:5. Using the two consecutive mergers with a mass ratio of 1:10 each to investigate the impact of a 1:5 minor merger is appropriate because it has been shown that the effect of multiple minor mergers is cumulative (Bournaud et al. 2007; Qu et al. 2010). This being the case, we analyzed several possible consecutive merger configurations. We considered mergers of two dS0 galaxies on a gS0, mergers of two dSa galaxies on a gSa, and mergers of two dSb galaxies on a gSb; simulating both direct and retrograde encounters. The result of this analysis is summarized in Fig. 2, which represents the eccentricity distribution of stars that results from a 2 × (1:10) merger of a gSb galaxy and two dSbs on direct orbits. We find that the consecutive minor mergers cause an increase in the contribution of satellite stars to the high eccentricity tail of the distribution. We note also that the overall distribution tends to shift towards higher values of the eccentricity (this is clear when comparing the results of the direct 1:10 merger for fgas = 20% in Fig. 1 with Fig. 2). In the six cases we analyzed, we never found the secondary peak identified by Sales et al. (2009). The mass of the satellite certainly tends to increase the contribution of satellite stars to the high eccentricity tail of the distribution, but it appears insufficient in itself to create a second peak. Other parameters must play a role, perhaps a decisive role in creating a second peak. For example, the orbital configuration of course has an effect, but this difference may also depend on the details of the minor merger model analyzed by Sales et al. (2009), which consists of two galaxies (a primary and its satellite) embedded in dark halos with a NFW profile. A different central concentration in the dark matter profile may cause dynamical friction to have a slower/delayed impact allowing the satellite to survive longer, thus the orbit to become more eccentric for a more massive and/or centrally concentrated satellite. All of this may result in a final eccentricity distribution of stars in the remnant galaxy that is different from and extends to higher values than those we found.
We do not mean to claim that the distributions of stellar eccentricities shown in Fig. 1 represent the general outcome for minor mergers, only that they are a possible outcome, compatible with the eccentricity of thick disk stars in the solar neighborhood (Dierickx et al. 2010; Wilson et al. 2010). Nevertheless, the eccentricity distribution found in our simulations, for the direct merger with a gas fraction of 20% in the disk, is remarkably similar to those observed in the Milky Way thick disk. Dierickx et al. (2010) and Wilson et al. (2010) found a peak at low eccentricities with a smooth decline at higher values as we have in our simulations (Fig. 3).
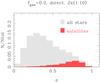 |
Fig. 2 Eccentricity distribution of thick disk stellar particles for a 2 × (1:10) consecutive minor merger with a gas fraction fgas = 0.2. As in Fig. 1, stars have been selected in a cylindrical shell at disk scale lengths, Rd, from 2 ≤ R/Rd ≤ 3, and at heights, z0, from 1 ≤ z/z0 ≤ 3. The contribution of stars accreted from the satellite galaxies is shown in red. |
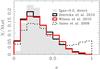 |
Fig. 3 Comparison of the eccentricity distributions of stellar particles of one of our minor merger models with the distributions found by Dierickx et al. (2010) and Wilson et al. (2010) for stars in the solar neighborhood. For comparison, the distribution found by Sales et al. (2009) for their “heating” (i.e., minor merger) scenario is also shown. In particular, one should note the secondary peak at high values of e, which is not seen in our simulations of 1:10 minor mergers. |
Interestingly, we also find that the eccentricity distributions as a function of z show a dependency on the initial orbit of the satellite galaxy. If the satellite is accreted along a direct orbit (i.e. if the z component of the orbital angular momentum is parallel to the primary internal angular momentum), the eccentricities show a trend with the vertical distance from the mid-plane: the larger the distance from the mid-plane, the greater the typical stellar eccentricity. This trend can be explained in terms of a rotational lag of the thick disk as a function of z, which can be induced by minor mergers (Villalobos & Helmi 2008) but whose amplitude and behavior strongly depend on the satellite orbit (Qu et al., in prep.). In direct encounters, the strong coupling of the satellite motion to the disk internal rotation induces a higher perturbation of the kinematics of stars in the primary disk, increasing the overall radial velocity dispersion and decreasing the overall rotational support. This effect also manifests itself in the amplitude of the rotational lag of the thick disk. As the stars in the thick disk mostly originated in the thin disk of the primary, the lag must increase with z. For retrograde orbits, however, the lack of strong gravitational coupling between satellite and disk produces a much smaller effect – stars in the thick disk rotate slower than those in the thin disk, but this lag does not show any dependence on vertical height, except at very large mid-plane distances (above z > 5z0). The absence of a trend between the rotational support and z for retrograde encounters is reflected directly in the distribution of eccentricities, which does not change significantly with increasing z. In particular, the peak of the distribution is constant at |z/z0|≤ 5, and increases only at even larger disk heights.
Thus the observational trend found by Dierickx et al. (2010), where stellar orbits become more eccentric as one moves away from the Galactic plane, can only be reproduced by our models if the satellite is accreted along a direct orbit.
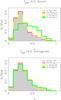 |
Fig. 4 Height-dependence of the stellar eccentricity distribution in a cylindrical shell with 2 ≤ R/Rd ≤ 3, for a direct (top row) and a retrograde (bottom row) 1:10 merger, with fgas = 20%. In each panel, the histograms correspond to different heights z above and below the galaxy mid-plane as indicated in the legend. |
4. Conclusions
By means of N-body/SPH simulations, we have investigated the distribution of orbital eccentricities of stars in thick disks formed by heating of a thin stellar disk after minor mergers with 1:10 mass ratios. The simulated interactions span a range in both gas fractions of the primary disk and initial orbital parameters. The eccentricity distributions have an approximately triangular shape, with a peak around e = 0.2−0.35, and a relatively smooth decline towards higher eccentricities. The exact distribution depends on the gas-to-stellar disk mass fraction in the primary disk, in the sense that higher gas fractions lead to lower peak eccentricity values. It also depends on the orbital configuration – direct orbits tend to produce broader eccentricity distributions than retrograde encounters. Stars that originated from the satellite galaxy tend to have relatively high eccentricities after the merger is completed (on average e = 0.45 to 0.75), similar to those recently found in simulations by Sales et al. (2009) but do not reach the highest values that these authors found nor show their secondary peak at e ~ 0.8. This is likely a consequence of the lower satellite mass of the satellites in our simulations, of the different dark-matter halo profiles used to model the galaxies, and our greater range of initial orbital configurations. The absence of this secondary peak at high eccentricities, in all our models, results in a distribution of eccentricities that matches qualitatively the observations (Dierickx et al. 2010; Wilson et al. 2010). Moreover, the increase in the orbital eccentricities of stars in the solar neighborhood with vertical distance from the galaxy mid-plane found by Dierickx et al. (2010) can also be qualitatively reproduced by our models, but only if the merging satellite is accreted on a direct orbit. No trend is found for retrograde orbits, except for stars high above the mid-plane at distances greater than 5z0.
On the basis of these models, we conclude that the observed distribution of orbital eccentricities of stars in the Galactic thick disk is in qualitative agreement with a scenario where the thick disk has been (predominantly?) formed by heating the thin disk during the impact of a (or perhaps multiple) minor merger(s) (whose effects are likely cumulative Qu et al. 2010). As we have discussed, the formation of a thick disk in situ, i.e., after the merger of gas-rich progenitors in the early universe, cannot be ruled out based on our models or other evidence, because its observed eccentricity distribution is also qualitatively similar to that observed.
For a satellite accreted on a direct orbit, our models can also reproduce the trend found by Dierickx et al. (2010) that satellite orbits become more eccentric as one moves away from the Milky Way plane. We speculate that if minor mergers were the dominant means of forming the Milky Way thick disk, the major contributor should have been merger(s) with satellite(s) on direct orbits. If the thick disk of the Milky Way was formed by external heating, other processes may have contributed to its subsequent evolution and helped to shape its current characteristics. Radial migration (Sellwood & Binney 2002; Roškar et al. 2008a,b), for example, is particularly efficient if asymmetries such as bars and spiral arms develop in the thin disk (Debattista et al. 2006; Foyle et al. 2008; Minchev et al. 2010a,b) and may well have played an important role in influencing the kinematic and chemical properties of the early formed thick disk (Loebman et al. 2010). Crucial tests of the viability of processes such as minor mergers will be made through detailed comparisons that are not restricted to eccentricity data but will involve the kinematic properties and metal abundances and ratios of the stars in the thick disk.
The presently available computational facilities ensure that the investigation of a large number of parameters and accretion histories is feasible. By comparing the signatures produced by different accretion events in the kinematics and metallicity of the thin/thick disk and halo of the Galaxy, the future observations by GAIA and LAMOST, for example, will have a key role in understanding the mass accretion history of our Galaxy and its impact on the formation and evolution of the thick disk.
By “old stars”, we mean stars already present in the galaxy before the interaction, whereas by “new” stars, we mean stars that are formed during the interaction from the gas, if initially present in the disk. New stars are distributed in both a thin disk (scale height of hundreds of parsecs) and the bulge. They do not contribute to the thick disk.
Hereafter, we denote simulations of these consecutive mergers as “2 × (1:10)”.
Acknowledgments
Y.Q. and P.D.M. are supported by a grant from the French Agence Nationale de la Recherche (ANR). We are grateful to Benoît Semelin and Françoise Combes for developing the code used in this paper and for their permission to use it. These simulations will be made available as part of the GalMer simulation data base (http://galmer.obspm.fr). We thank the referee for her/his comments and suggestions, which improved the clarity of the paper and the presentation of the results.
References
- Abadi, M. G., Navarro, J. F., Steinmetz, M., & Eke, V. R. 2003, ApJ, 597, 21 [NASA ADS] [CrossRef] [MathSciNet] [Google Scholar]
- Banerjee, A., & Jog, C. J. 2007, ApJ, 662, 335 [NASA ADS] [CrossRef] [Google Scholar]
- Bournaud, F., Jog, C. J., & Combes, F. 2007, A&A, 476, 1179 [NASA ADS] [CrossRef] [EDP Sciences] [Google Scholar]
- Brook, C. B., Kawata, D., Gibson, B. K., & Freeman, K. C. 2004, ApJ, 612, 894 [NASA ADS] [CrossRef] [Google Scholar]
- Brook, C. B., Gibson, B. K., Martel, H., & Kawata, D. 2005, ApJ, 630, 298 [NASA ADS] [CrossRef] [Google Scholar]
- Chilingarian, I. V., Di Matteo, P., Combes, F., Melchior, A. L., & Semelin, B. 2010, A&A, 518, 61 [Google Scholar]
- Debattista, V. P., Mayer, L., Carollo, C. M., et al. 2006, ApJ, 645, 209 [NASA ADS] [CrossRef] [Google Scholar]
- Dierickx, M., Klement, R. J., Rix, H.-W., & Liu, C. 2010, ApJL, submitted [arXiv:1009.1616] [Google Scholar]
- Foyle, K., Courteau, S., & Thacker, R. J. 2008, MNRAS, 386, 1821 [NASA ADS] [CrossRef] [Google Scholar]
- Loebman, S. R., Roskar, R., Debattista, V. P., et al. 2010 [arXiv:1009.5997] [Google Scholar]
- Minchev, I., & Famaey, B. 2010, ApJ, 722, 112 [NASA ADS] [CrossRef] [Google Scholar]
- Minchev, I., Famaey, B., Combes, F., et al. 2010, A&A, submitted [arXiv:1006.0484] [Google Scholar]
- Qu, Y., Di Matteo, P., Lehnert, M. D., & van Driel, W. 2010, A&A, submitted [Google Scholar]
- Roškar, R., Debattista, V. P., Stinson, G. S., et al. 2008a, ApJ, 675, L65 [NASA ADS] [CrossRef] [Google Scholar]
- Roškar, R., Debattista, V. P., Quinn, T. R., et al. 2008b, ApJ, 684, L79 [NASA ADS] [CrossRef] [Google Scholar]
- Sales, L. V., Helmi, A., Abadi, M. G., et al. 2009, MNRAS, 400, L61 [NASA ADS] [CrossRef] [Google Scholar]
- Sellwood, J. A., & Binney, J. J. 2002, MNRAS, 336, 785 [NASA ADS] [CrossRef] [Google Scholar]
- Semelin, B., & Combes, F. 2002, A&A 388, 826 [NASA ADS] [CrossRef] [EDP Sciences] [Google Scholar]
- Villalobos, A., & Helmi, A. 2008, MNRAS, 391, 1806 [NASA ADS] [CrossRef] [Google Scholar]
- Wilson, M., Helmi, A., Morrison, H. L., et al. 2010, MNRAS, submitted [arXiv:1009.2052] [Google Scholar]
All Figures
|
Fig. 1 Eccentricity distribution of stellar particles in a number of 1:10 minor mergers within a cylindrical shell at disk scale lengths, Rd, from 2 ≤ R/Rd ≤ 3, and at heights, z0, from 1 ≤ z/z0 ≤ 3. From left to right: the gas-to-stellar disk mass fraction increases from fgas = 0, 0.1, and 0.2 in each panel. Mergers on direct orbits are shown in the top row, ones on retrograde orbits are shown in the panels of the bottom row. We indicated both the contribution of stars initially in the satellite galaxy (red histogram) and the distribution of all the stars (grey histograms). The dashed histogram in the upper-left panel corresponds to a high-resolution simulation, employing a total of 1320000 particles and a softening length ϵ = 150 pc. The results of the higher resolution simulation are in qualitatively in agreement with those of the lower resolutions simulations. |
| In the text | |
|
Fig. 2 Eccentricity distribution of thick disk stellar particles for a 2 × (1:10) consecutive minor merger with a gas fraction fgas = 0.2. As in Fig. 1, stars have been selected in a cylindrical shell at disk scale lengths, Rd, from 2 ≤ R/Rd ≤ 3, and at heights, z0, from 1 ≤ z/z0 ≤ 3. The contribution of stars accreted from the satellite galaxies is shown in red. |
| In the text | |
|
Fig. 3 Comparison of the eccentricity distributions of stellar particles of one of our minor merger models with the distributions found by Dierickx et al. (2010) and Wilson et al. (2010) for stars in the solar neighborhood. For comparison, the distribution found by Sales et al. (2009) for their “heating” (i.e., minor merger) scenario is also shown. In particular, one should note the secondary peak at high values of e, which is not seen in our simulations of 1:10 minor mergers. |
| In the text | |
|
Fig. 4 Height-dependence of the stellar eccentricity distribution in a cylindrical shell with 2 ≤ R/Rd ≤ 3, for a direct (top row) and a retrograde (bottom row) 1:10 merger, with fgas = 20%. In each panel, the histograms correspond to different heights z above and below the galaxy mid-plane as indicated in the legend. |
| In the text | |
Current usage metrics show cumulative count of Article Views (full-text article views including HTML views, PDF and ePub downloads, according to the available data) and Abstracts Views on Vision4Press platform.
Data correspond to usage on the plateform after 2015. The current usage metrics is available 48-96 hours after online publication and is updated daily on week days.
Initial download of the metrics may take a while.