Fig. 3
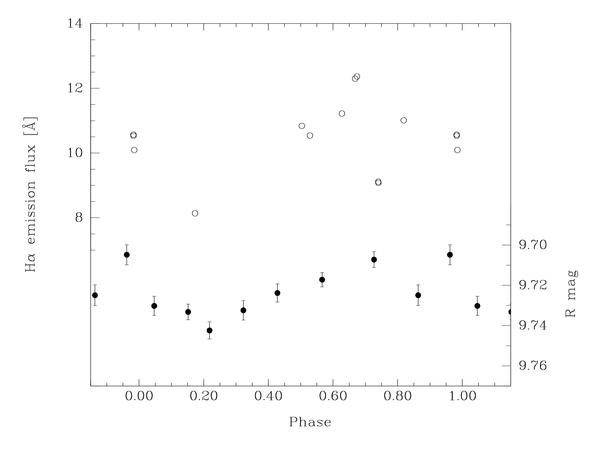
Variations in the Hα emission flux over the rotation period (open circles), relative to the variation in the R-band light curve (filled circles). The internal errors in the Hα emission flux measurements are smaller than the symbol size, but gross variations in the flux from cycle to cycle are expected.
Current usage metrics show cumulative count of Article Views (full-text article views including HTML views, PDF and ePub downloads, according to the available data) and Abstracts Views on Vision4Press platform.
Data correspond to usage on the plateform after 2015. The current usage metrics is available 48-96 hours after online publication and is updated daily on week days.
Initial download of the metrics may take a while.