Fig. 2
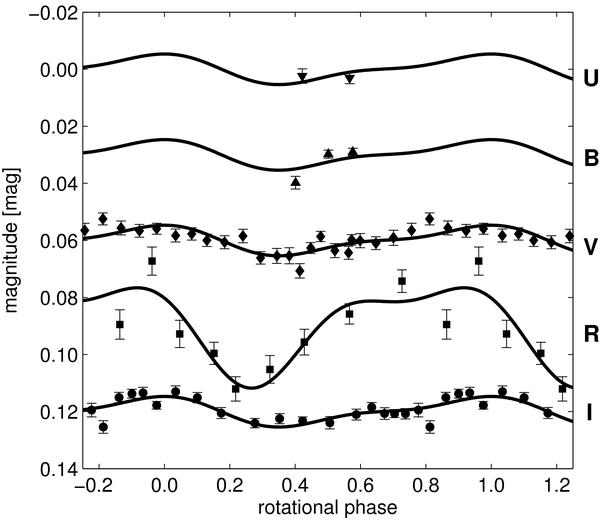
UBVR and I light curves of HD 101412. Solid lines present the simplest periodic functions representing the observed photometric variations (see Appendix A). Because of the large scatter in individual measurements (see Appendix B), the standard technique of normal points (determining averages of several tens of phase adjacent measurements) was used. The light curves are shifted along the y-axis for clarity.
Current usage metrics show cumulative count of Article Views (full-text article views including HTML views, PDF and ePub downloads, according to the available data) and Abstracts Views on Vision4Press platform.
Data correspond to usage on the plateform after 2015. The current usage metrics is available 48-96 hours after online publication and is updated daily on week days.
Initial download of the metrics may take a while.