Free Access
Fig. 3
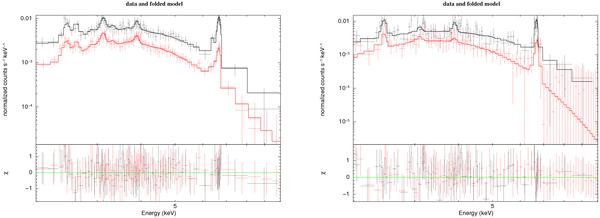
The 2–10 keV X-ray spectra of the AC as measured in the PN (black) and MOS (red) cameras. Left panel: the spectrum measured in the normal state. Right panel: the net flare spectrum measured during the flaring episode. In both cases, the best fitting spectral model and the corresponding residuals are also shown.
This figure is made of several images, please see below:
Current usage metrics show cumulative count of Article Views (full-text article views including HTML views, PDF and ePub downloads, according to the available data) and Abstracts Views on Vision4Press platform.
Data correspond to usage on the plateform after 2015. The current usage metrics is available 48-96 hours after online publication and is updated daily on week days.
Initial download of the metrics may take a while.