Free Access
Fig. 3
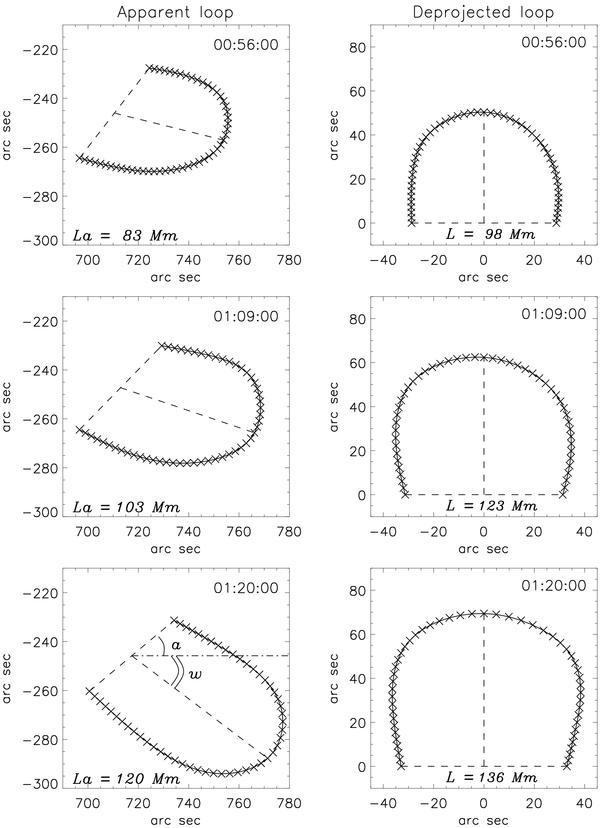
Apparent flare loop axes in the observer’s coordinate system extracted from NoRH images (left column) and their deprojections in the loop plane coordinate system (right column) at three different times depicted in the plots. Loop footpoint baselines and axes of symmetry are shown by dashed lines.
Current usage metrics show cumulative count of Article Views (full-text article views including HTML views, PDF and ePub downloads, according to the available data) and Abstracts Views on Vision4Press platform.
Data correspond to usage on the plateform after 2015. The current usage metrics is available 48-96 hours after online publication and is updated daily on week days.
Initial download of the metrics may take a while.