Free Access
Fig. 2
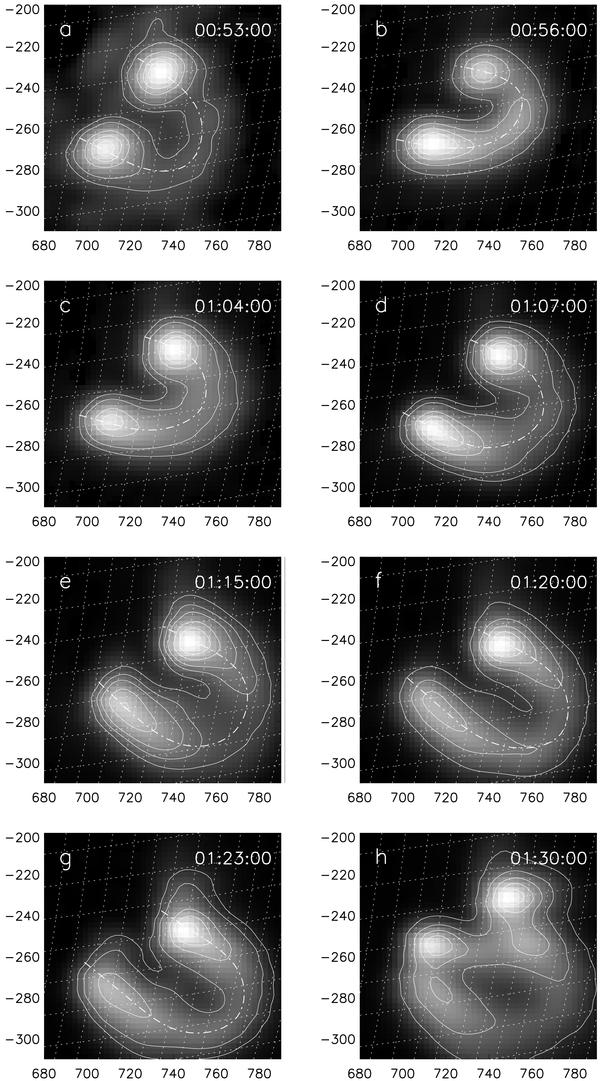
NoRH images of the flare source at 17 GHz, I at different moments in time. Contours correspond to 0.1, 0.3, 0.5, 0.7, 0.9 levels of maximum  . The brightness of filling increases with the increasing of Tb. The dot-dashed lines show visible flaring loop axes. The units of the X- and Y-axis are arcsec from the disk center.
Current usage metrics show cumulative count of Article Views (full-text article views including HTML views, PDF and ePub downloads, according to the available data) and Abstracts Views on Vision4Press platform.
Data correspond to usage on the plateform after 2015. The current usage metrics is available 48-96 hours after online publication and is updated daily on week days.
Initial download of the metrics may take a while.