Fig. 3
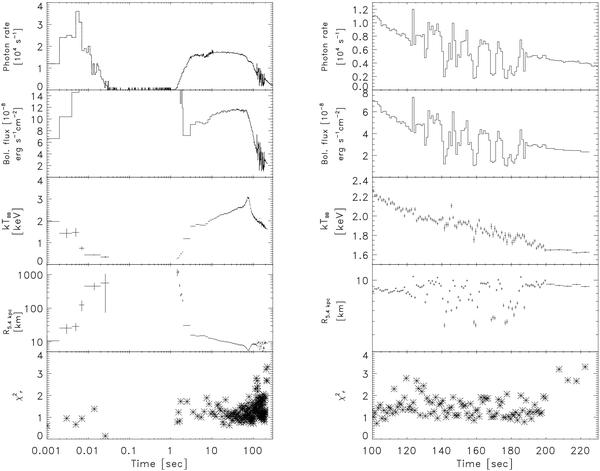
Time-resolved spectroscopy of the burst from 2S 0918-549. The top panel shows the full bandpass lightcurve of the xenon layers, the second panel the bolometric flux (early values suffer from statistical errors between 10 and 20%), the third panel the blackbody temperature in terms of kTeff, the fourth panel the blackbody radius for a distance of 5.4 kpc, and the bottom panel the reduced χ2 for the fits per time bin.

Current usage metrics show cumulative count of Article Views (full-text article views including HTML views, PDF and ePub downloads, according to the available data) and Abstracts Views on Vision4Press platform.
Data correspond to usage on the plateform after 2015. The current usage metrics is available 48-96 hours after online publication and is updated daily on week days.
Initial download of the metrics may take a while.