Fig. 9
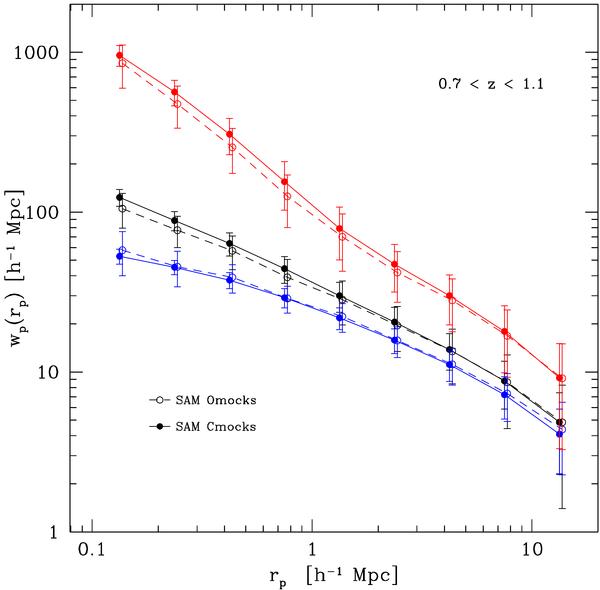
Mean projected correlation function at 0.7 < z < 1.1 for red (top curves), all (middle curves), and blue (bottom curves) galaxies in the Omocks (dashed curves) and Cmocks (solid curves) samples. The error bars correspond to the 1σ field-to-field dispersion among the mock samples. Omocks points have been slightly displaced along rp-axis to improve the clarity of the figure.
Current usage metrics show cumulative count of Article Views (full-text article views including HTML views, PDF and ePub downloads, according to the available data) and Abstracts Views on Vision4Press platform.
Data correspond to usage on the plateform after 2015. The current usage metrics is available 48-96 hours after online publication and is updated daily on week days.
Initial download of the metrics may take a while.