Fig. 8
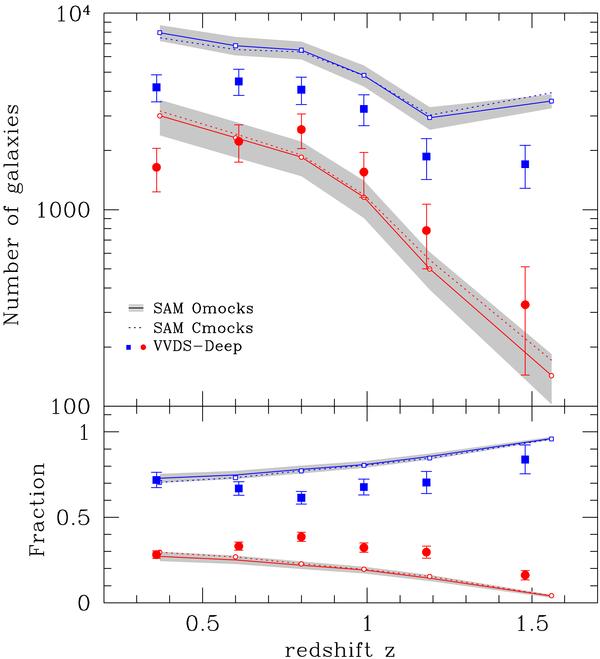
Total number and fraction of red (filled circles) and blue (filled squares) galaxies as a function of redshift in the VVDS-Deep and in the SAM. The symbols with error bars are the VVDS-Deep measurements while solid curves and associated shaded areas correspond to the predicted mean fractions and 1σ field-to-field dispersions among the Omocks. The dotted curves are the mean predictions of the Cmocks. In both upper and lower panel, higher curves and symbols correspond to blue galaxies.
Current usage metrics show cumulative count of Article Views (full-text article views including HTML views, PDF and ePub downloads, according to the available data) and Abstracts Views on Vision4Press platform.
Data correspond to usage on the plateform after 2015. The current usage metrics is available 48-96 hours after online publication and is updated daily on week days.
Initial download of the metrics may take a while.