Fig. 6
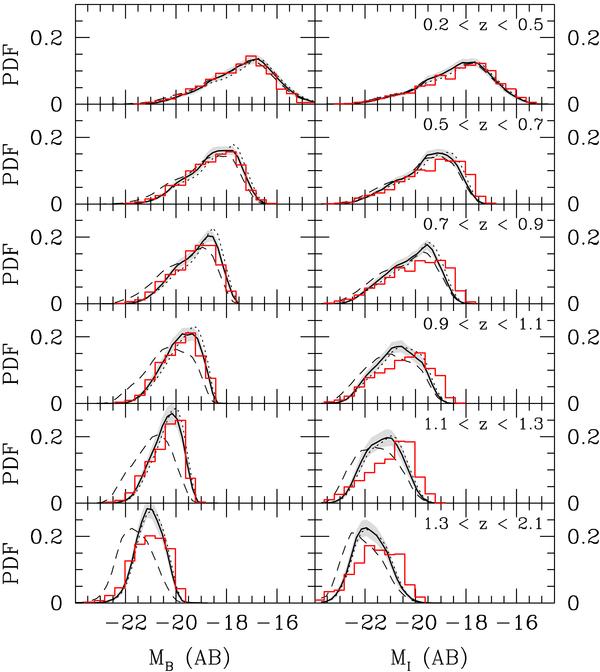
Comparison of the rest-frame B-band (right panels) and I-band (left panels) distributions in six magnitude-limited samples from z = 0.2 to z = 2.1. The histograms are VVDS-Deep measurements while the curves and associated shaded areas correspond to the mean and the 1σ field-to-field dispersion among the Omocks samples. The dashed curves are the mean distribution in the Omocks without including dust extinction in the model, while the dotted ones are the mean predictions of the Cmocks.
Current usage metrics show cumulative count of Article Views (full-text article views including HTML views, PDF and ePub downloads, according to the available data) and Abstracts Views on Vision4Press platform.
Data correspond to usage on the plateform after 2015. The current usage metrics is available 48-96 hours after online publication and is updated daily on week days.
Initial download of the metrics may take a while.