Fig. 5
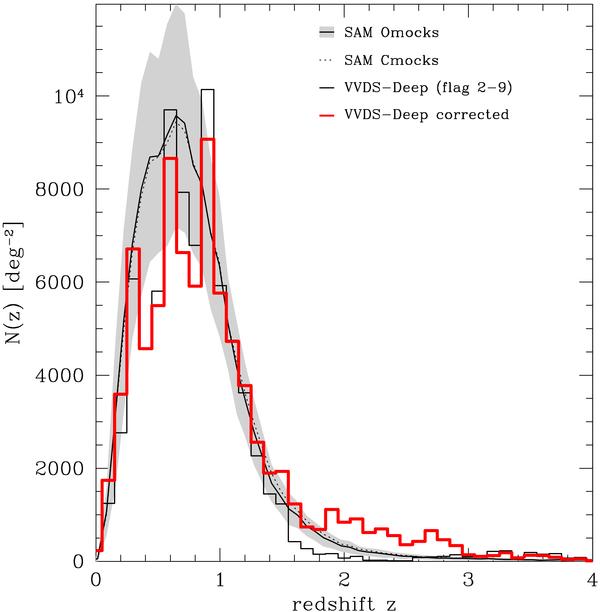
Comparison of the VVDS-Deep with the SAM redshift distributions for 17.5 < IAB < 24 galaxies. The VVDS-Deep N(z), while including only flag 2 to 9 galaxies, is shown with the solid thin histogram. The thick histogram corresponds to the corrected N(z) in the VVDS-Deep when accounting for the observational biases of the survey (see text for details). The solid curve and associated shaded area are the mean and the 1σ field-to-field dispersion among the Omocks, while the dotted curve is the mean prediction of the Cmocks.
Current usage metrics show cumulative count of Article Views (full-text article views including HTML views, PDF and ePub downloads, according to the available data) and Abstracts Views on Vision4Press platform.
Data correspond to usage on the plateform after 2015. The current usage metrics is available 48-96 hours after online publication and is updated daily on week days.
Initial download of the metrics may take a while.