Fig. 4
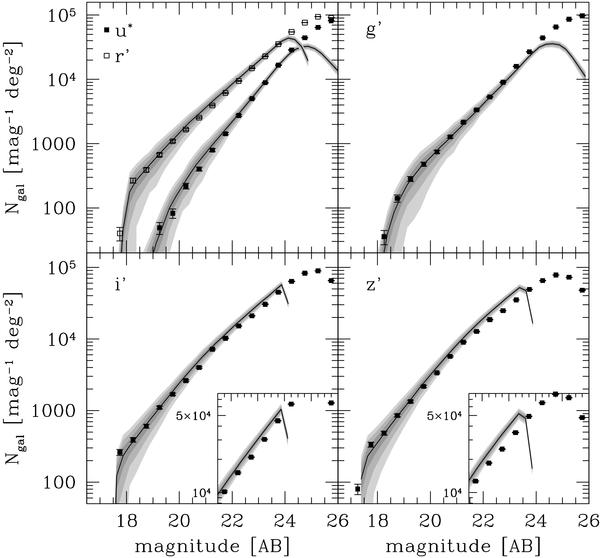
Comparison of the magnitude counts in the CFHTLS u ∗ , g′, r′, i′, z′ optical bands with SAM predictions for 17.5 < I < 24 galaxies. The CFHTLS counts are shown with the squares and the error bars correspond to their Poisson errors. The curves and associated shaded areas are respectively the mean and the 1σ, 2σ, and 3σ field-to-field dispersions among the Cmocks samples. SAM predictions are for samples explicitly cut at I = 24, while CFHTLS counts extend above this limit. All galaxies with I < 17.5 have been removed from the counts.
Current usage metrics show cumulative count of Article Views (full-text article views including HTML views, PDF and ePub downloads, according to the available data) and Abstracts Views on Vision4Press platform.
Data correspond to usage on the plateform after 2015. The current usage metrics is available 48-96 hours after online publication and is updated daily on week days.
Initial download of the metrics may take a while.