Fig. 3
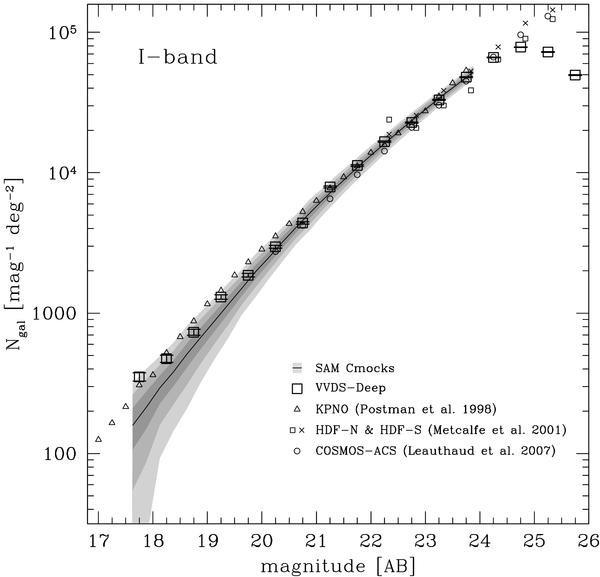
Comparison of the magnitude counts in the VDIS I-band with SAM predictions and previously reported measurements by Postman et al. (1998) in the KPNO survey, Leauthaud et al. (2007) in the COSMOS-ACS field, and Metcalfe et al. (2001) in the Hubble Deep Field-North & South. The VVDS-Deep counts are shown with the empty squares and the error bars correspond to their associated Poisson errors. The solid curve and associated shaded areas are respectively the mean and the 1σ, 2σ, and 3σ field-to-field dispersions among Cmocks samples.
Current usage metrics show cumulative count of Article Views (full-text article views including HTML views, PDF and ePub downloads, according to the available data) and Abstracts Views on Vision4Press platform.
Data correspond to usage on the plateform after 2015. The current usage metrics is available 48-96 hours after online publication and is updated daily on week days.
Initial download of the metrics may take a while.