Fig. 13
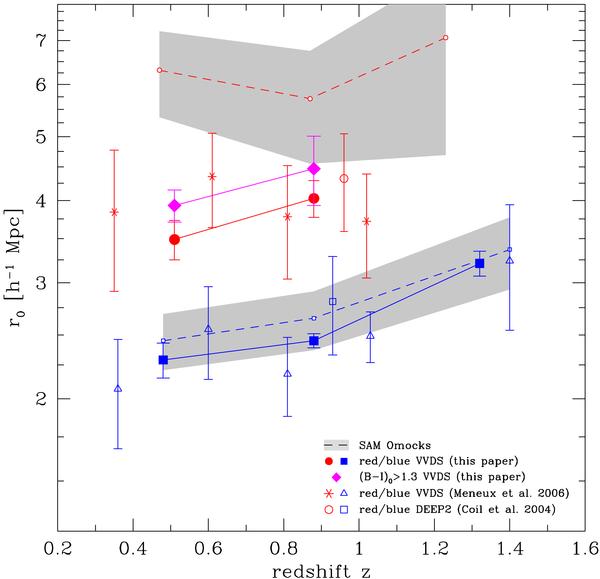
Comparison of the correlation lengths of red and blue galaxies as a function of redshift. The filled symbols with error bars are VVDS-Deep measurements while the dashed curves and associated shaded areas correspond to the correlation lengths and errors in the Omocks. We also report previous VVDS-Deep measurements by Meneux et al. (2006) as well as those of Coil et al. (2004) from DEEP2 survey, both using different colour criteria. We refer the reader to the inset for the detail of the plotted symbols.
Current usage metrics show cumulative count of Article Views (full-text article views including HTML views, PDF and ePub downloads, according to the available data) and Abstracts Views on Vision4Press platform.
Data correspond to usage on the plateform after 2015. The current usage metrics is available 48-96 hours after online publication and is updated daily on week days.
Initial download of the metrics may take a while.