Fig. 12
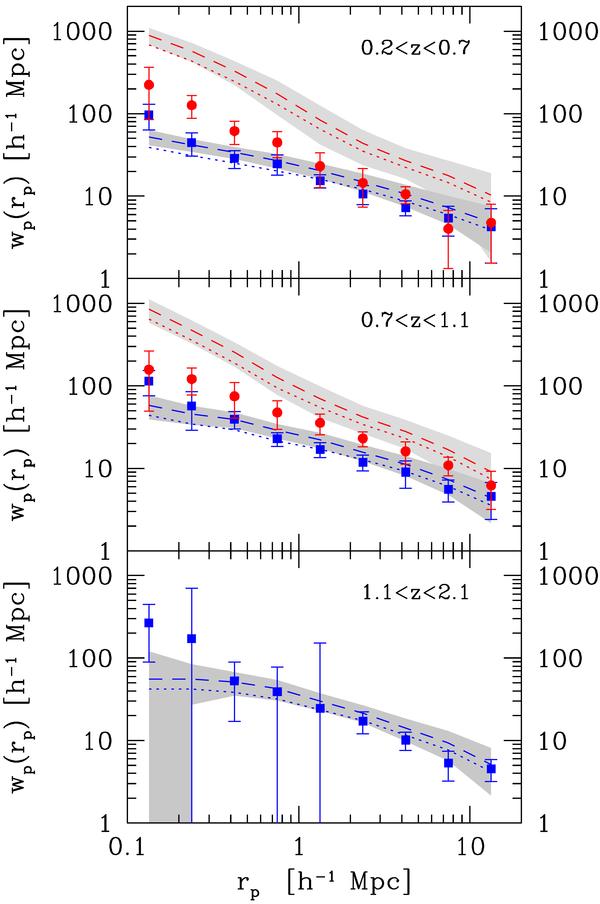
Colour-dependent projected correlation functions in three redshift intervals from z = 0.2 to z = 2.1, both observed in the VVDS-Deep and predicted by the SAM. In each panel, the filled circles (red galaxies) and filled squares (blue galaxies) correspond to VVDS-Deep measurements, while the dashed curves and associated shaded areas correspond to the mean and the 1σ dispersion among the Omocks. The dotted curves are the mean wp(rp) obtained by rescaling the predicted correlations function to σ8 = 0.81 as described in Sect. 4.2. In all panels, both for VVDS-Deep and SAM galaxies, the wp(rp) with higher global amplitude corresponds to that of red galaxies.
Current usage metrics show cumulative count of Article Views (full-text article views including HTML views, PDF and ePub downloads, according to the available data) and Abstracts Views on Vision4Press platform.
Data correspond to usage on the plateform after 2015. The current usage metrics is available 48-96 hours after online publication and is updated daily on week days.
Initial download of the metrics may take a while.