Fig. 11
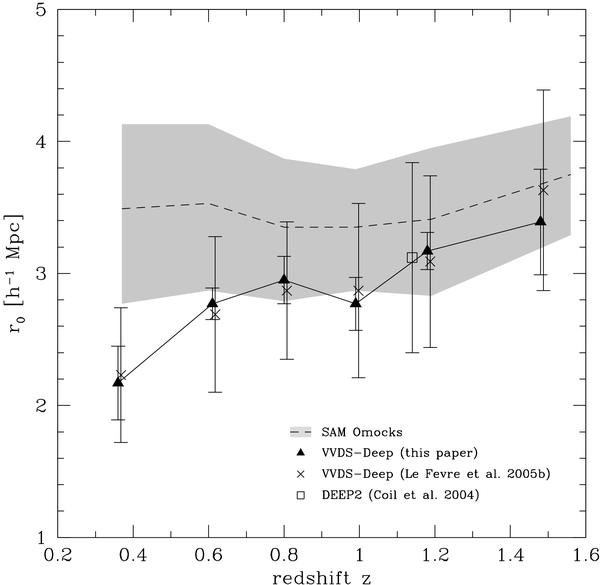
Comparison of the correlation lengths as a function of redshift. The filled triangles with error bars are VVDS-Deep measurements while the dashed curve and associated shaded area correspond to the correlation length and error from the Omocks. We also report in this figure the previous VVDS-Deep measurements by Le Fèvre et al. (2005b) (crosses) and the one obtained by Coil et al. (2004) in the DEEP2 survey (open square).
Current usage metrics show cumulative count of Article Views (full-text article views including HTML views, PDF and ePub downloads, according to the available data) and Abstracts Views on Vision4Press platform.
Data correspond to usage on the plateform after 2015. The current usage metrics is available 48-96 hours after online publication and is updated daily on week days.
Initial download of the metrics may take a while.