Fig. 10
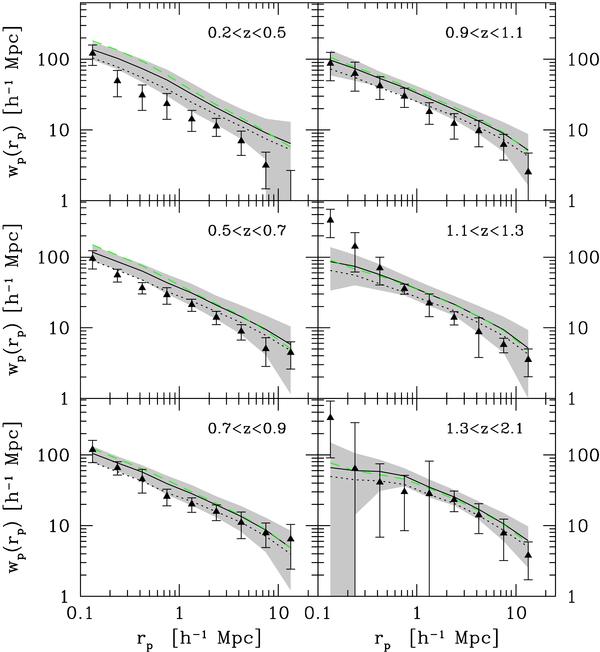
Comparison of the projected correlation functions as a function of redshift. In each panel, the filled triangles with error bars correspond to VVDS-Deep measurements while the solid curve and associated shaded area correspond to the mean and the 1σ field-to-field dispersion among the Omocks samples. The dashed curves are the mean Cmocks predictions, while the dotted ones are the mean wp(rp) obtained by rescaling the predicted correlations function in the Omocks to σ8 = 0.81 as described in Sect. 4.2.
Current usage metrics show cumulative count of Article Views (full-text article views including HTML views, PDF and ePub downloads, according to the available data) and Abstracts Views on Vision4Press platform.
Data correspond to usage on the plateform after 2015. The current usage metrics is available 48-96 hours after online publication and is updated daily on week days.
Initial download of the metrics may take a while.