Fig. 9
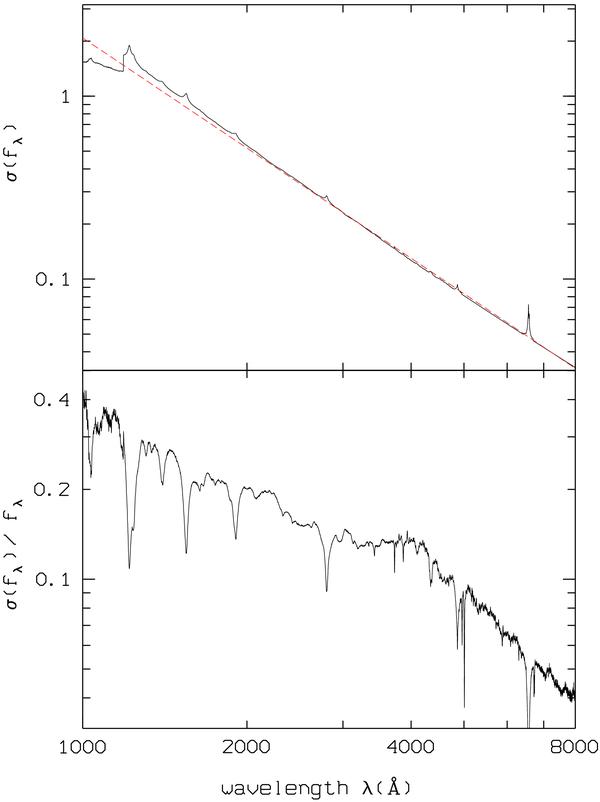
Top: wavelength dependence of the standard deviation
σ of the flux density
fλ for the best-fit model with
κ = 0.1. The dashed line corresponds to the power law with
slope −2. Bottom: ratio  where
where
 is the flux density of the
composite spectrum normalized at 4000 Å.
is the flux density of the
composite spectrum normalized at 4000 Å.
Current usage metrics show cumulative count of Article Views (full-text article views including HTML views, PDF and ePub downloads, according to the available data) and Abstracts Views on Vision4Press platform.
Data correspond to usage on the plateform after 2015. The current usage metrics is available 48-96 hours after online publication and is updated daily on week days.
Initial download of the metrics may take a while.