Fig. 8
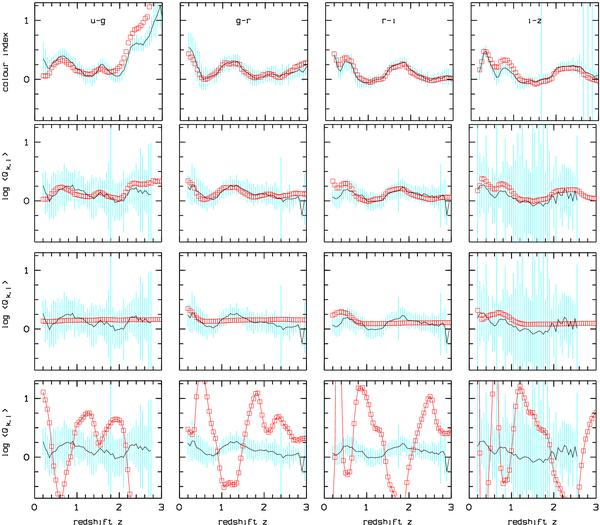
Comparison of simulations (open symbols) and observations (thin curves and 1σ deviations): colour indices (top) and variability ratios as functions of redshift for the best-fit model with with small line variability (κ = 0.11; second row), the same model with large line variability (κ = 1; third row), and for a model where only the line flux is variable (bottom), respectively.
Current usage metrics show cumulative count of Article Views (full-text article views including HTML views, PDF and ePub downloads, according to the available data) and Abstracts Views on Vision4Press platform.
Data correspond to usage on the plateform after 2015. The current usage metrics is available 48-96 hours after online publication and is updated daily on week days.
Initial download of the metrics may take a while.