Fig. 7
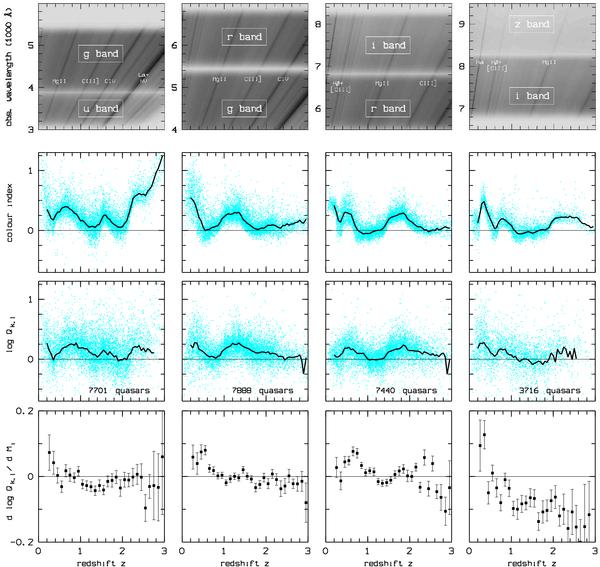
Top: spectral coverage of the quasar composite spectrum by two adjacent photometric bands k,l (k = u,g,v,r and l = g,v,r,i,z) as a function of redshift z. The next rows (top to bottom) show the corresponding colour indices mk − ml, the variability ratios Qk,l, and the gradients dlog Qk,l/dMi, respectively. Polygons: medians of colour index and log Qk,l, respectively.
Current usage metrics show cumulative count of Article Views (full-text article views including HTML views, PDF and ePub downloads, according to the available data) and Abstracts Views on Vision4Press platform.
Data correspond to usage on the plateform after 2015. The current usage metrics is available 48-96 hours after online publication and is updated daily on week days.
Initial download of the metrics may take a while.