Fig. 2
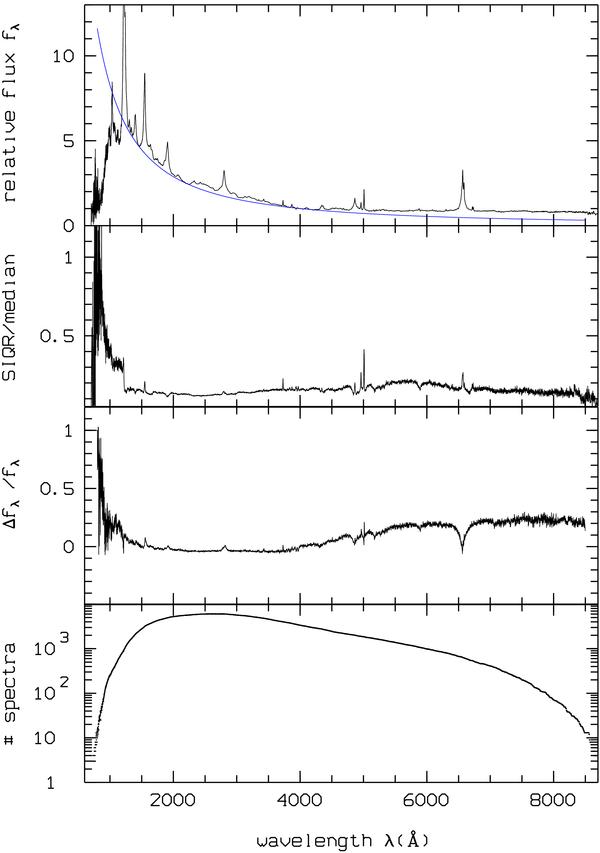
Top: median composite spectrum from the final quasar sample with fitting power-law continuum. Second row: the semi-interquartile range, SIQR, in units of the median. Third row: relative deviation from the Vanden Berk et al. (2001) composite ([here-Vanden Berk]/here). Bottom: number of spectra per wavelength bin used for the construction of the composite.
Current usage metrics show cumulative count of Article Views (full-text article views including HTML views, PDF and ePub downloads, according to the available data) and Abstracts Views on Vision4Press platform.
Data correspond to usage on the plateform after 2015. The current usage metrics is available 48-96 hours after online publication and is updated daily on week days.
Initial download of the metrics may take a while.