Fig. 10
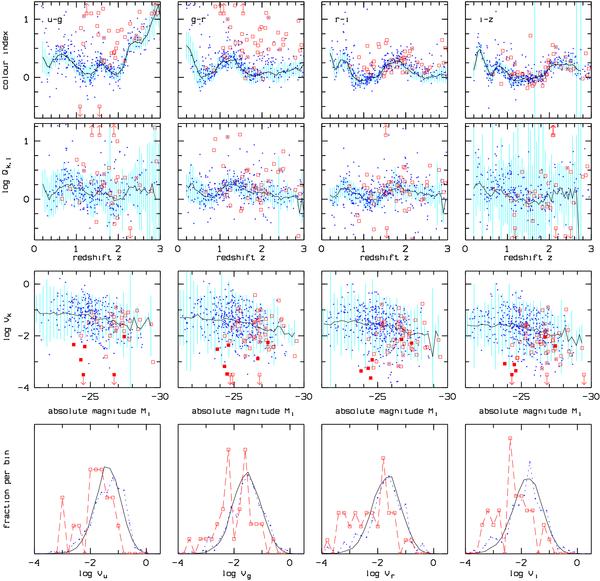
Colour indices, mk − ml, (top) and variability ratios, Qk,l, (second row) as a function of redshift and variability index, Vk, as a function of absolute magnitude, Mi, (third row) for radio-loud quasars (dots) and quasars with unusual spectra (squares and arrows), respectively. Curves and hatched areas as in Fig. 8, filled squares in the third row: unusual quasars with weak emission lines (Fig. 11, left panel). Bottom: normalized distributions of log Vk for the unusual quasars (open squares and dashed lines), the radio-loud quasars (dots and dotted lines), and the standard sample (solid).
Current usage metrics show cumulative count of Article Views (full-text article views including HTML views, PDF and ePub downloads, according to the available data) and Abstracts Views on Vision4Press platform.
Data correspond to usage on the plateform after 2015. The current usage metrics is available 48-96 hours after online publication and is updated daily on week days.
Initial download of the metrics may take a while.