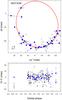
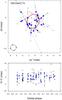
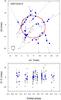
Fig. 20
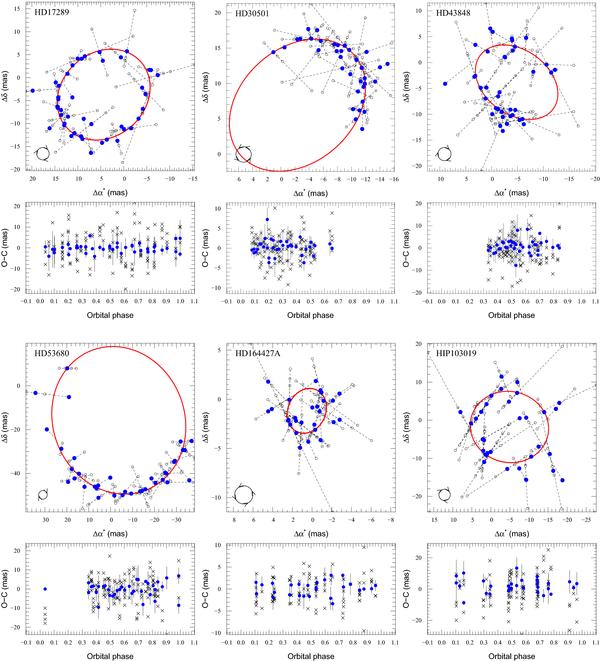
Visualisation of the high-significance orbits. Top panels: astrometric stellar orbits projected on the sky. North is up and east is left. The solid red line shows the orbital solution and open circles mark the individual Hipparcos measurements. Dashed lines with orientation along the scan angle ψ and length given by the O–C residual of the orbital solution connect the measurements with the predicted location from our model. The blue solid circles show the normal points for each satellite orbit number. The curl at the lower left corner indicates the orientation of orbital motion. Bottom panels: O–C residuals for the normal points of the orbital solution (filled blue circles) and of the standard 5-parameter model without companion (black crosses). The error bars of the normal points correspond to the dispersion of Hipparcos measurements if there are several per satellite orbit and to the individual Hipparcos abscissa error if there is only one measurement.
Current usage metrics show cumulative count of Article Views (full-text article views including HTML views, PDF and ePub downloads, according to the available data) and Abstracts Views on Vision4Press platform.
Data correspond to usage on the plateform after 2015. The current usage metrics is available 48-96 hours after online publication and is updated daily on week days.
Initial download of the metrics may take a while.