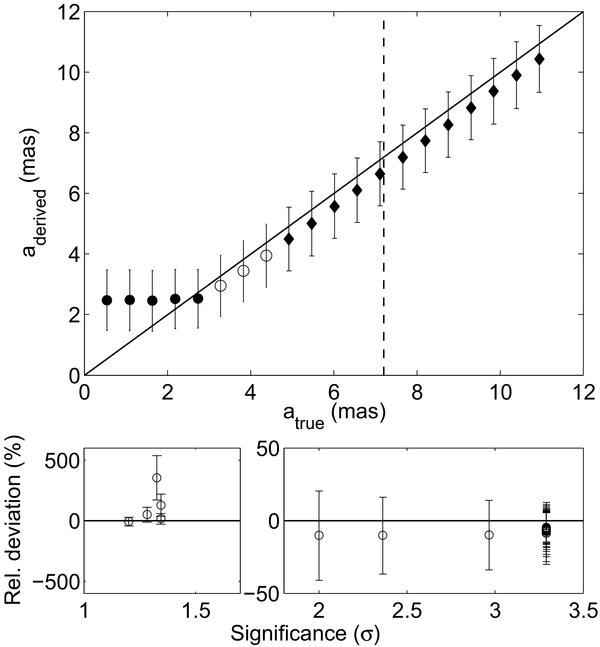
Fig. 10

Simulated difference between the derived semimajor axis aderived and its true value atrue. Top: aderived as function of atrue. Filled circles, open circles, and diamonds designate orbits of 1–2σ, 2–3σ, and >3σ significance, respectively. The solid line has unity slope and the dashed line shows the single-measurement precision of σΛ = 7.2 mas. Bottom: the relative deviation calculated as (aderived − atrue)/atrue as a function of significance. The accuracy and relative precision of the solution improve with significance. At the detection limit of 3-σ, the deviation from the true value is smaller than 0.5 mas.
Current usage metrics show cumulative count of Article Views (full-text article views including HTML views, PDF and ePub downloads, according to the available data) and Abstracts Views on Vision4Press platform.
Data correspond to usage on the plateform after 2015. The current usage metrics is available 48-96 hours after online publication and is updated daily on week days.
Initial download of the metrics may take a while.


