Fig. 9
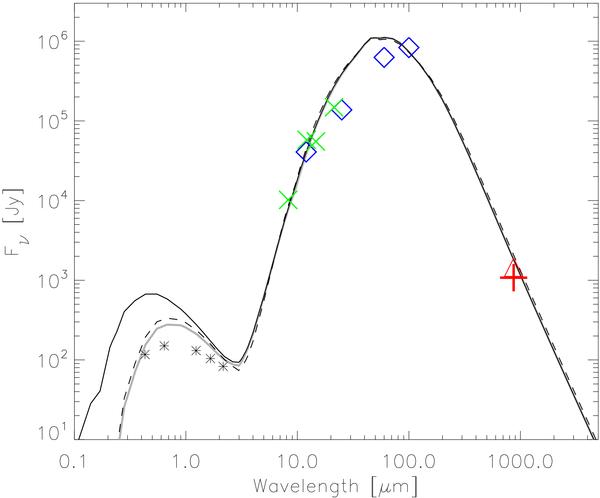
Spectral energy distribution of the Carina Nebula complex. The diamonds and crosses show the mid- and far-infrared fluxes determined from the IRAS and MSX maps for the field of the LABOCA map. The cross with the upward triangle shows the total 870 μm flux derived from our LABOCA map (excluding the emission from η Car and the Keyhole Nebula). The asterisks show the integrated optical and near-infrared fluxes of the known stellar members of Carina as identified in a deep Chandra X-ray survey (see Preibisch et al. 2011b). The solid line shows the spectral energy distribution resulting from our spherical cloud model of the CNC with a total gas + dust mass of 140 000 M⊙; the gray line shows the effect of adding 1 mag of visual foreground extinction to the spectrum. The dashed line is the model with a cloud mass of 280 000 M⊙.
Current usage metrics show cumulative count of Article Views (full-text article views including HTML views, PDF and ePub downloads, according to the available data) and Abstracts Views on Vision4Press platform.
Data correspond to usage on the plateform after 2015. The current usage metrics is available 48-96 hours after online publication and is updated daily on week days.
Initial download of the metrics may take a while.