Free Access
Fig. 6
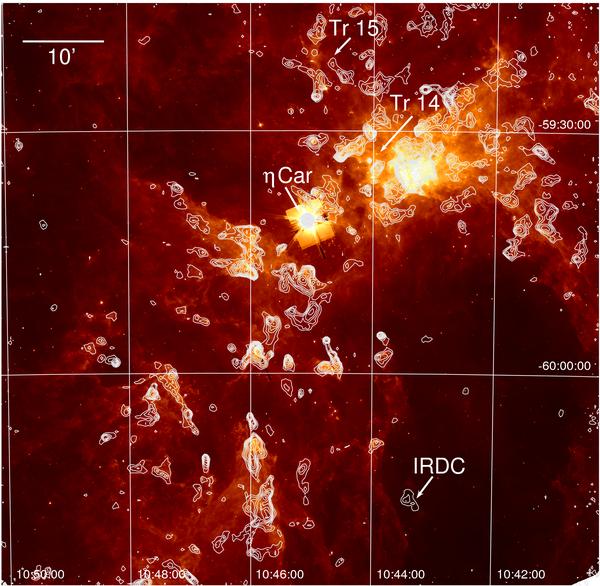
False-color representation of the 8.0 μm Spitzer image with superposed contours of the LABOCA map. In the area within a few arcminutes from η Car the very bright infrared emission caused strong artifacts in the Spitzer image. A grid of J2000 coordinates is shown.
Current usage metrics show cumulative count of Article Views (full-text article views including HTML views, PDF and ePub downloads, according to the available data) and Abstracts Views on Vision4Press platform.
Data correspond to usage on the plateform after 2015. The current usage metrics is available 48-96 hours after online publication and is updated daily on week days.
Initial download of the metrics may take a while.