Fig. 3
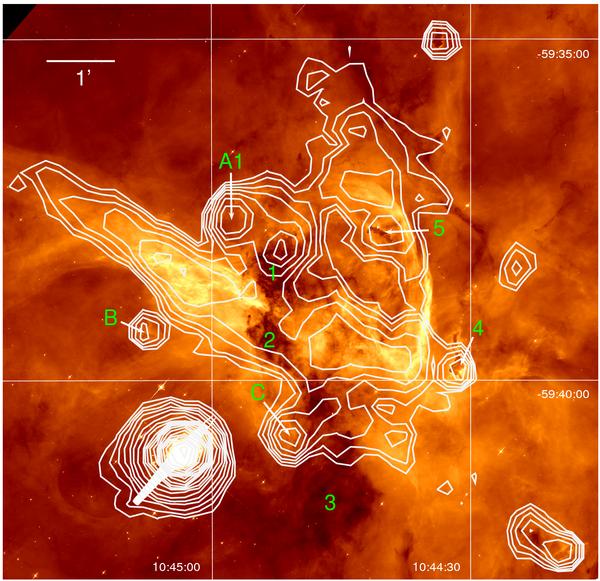
False-color representation of the HST Hα image of η Car and the Keyhole Nebula with superposed contours of the LABOCA map. The numbers 1–5, A1, B, and C refer to the CO clumps in the Keyhole Nebula defined in Cox & Bronfman (1995). The contour levels in this image start at 0.06 Jy/beam and increase on a logarithmic scale by factors of 1.364 (i.e. 0.135 dex).
Current usage metrics show cumulative count of Article Views (full-text article views including HTML views, PDF and ePub downloads, according to the available data) and Abstracts Views on Vision4Press platform.
Data correspond to usage on the plateform after 2015. The current usage metrics is available 48-96 hours after online publication and is updated daily on week days.
Initial download of the metrics may take a while.