Fig. 2
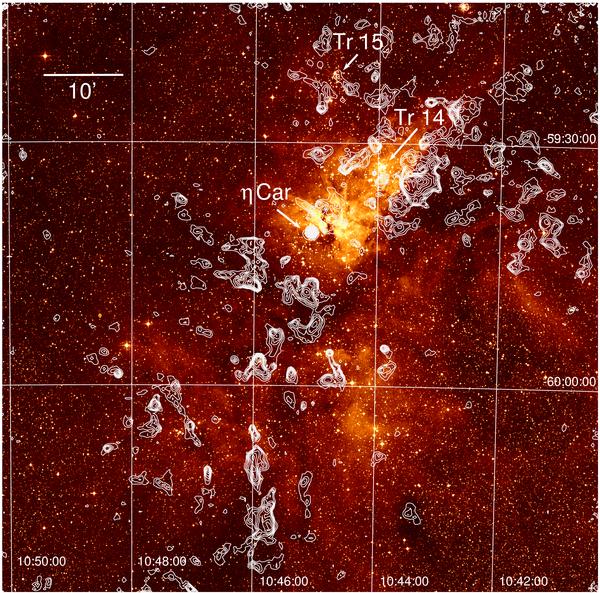
False-color representation of the red optical Digitized Sky Survey image with contours of the LABOCA map overplotted. Here and (unless noted otherwise) in the following images, the first three contour levels are 0.06, 0.12, and 0.18 Jy/beam, while the further levels increase by a factor of  . The grid shows the J2000 coordinates.
Current usage metrics show cumulative count of Article Views (full-text article views including HTML views, PDF and ePub downloads, according to the available data) and Abstracts Views on Vision4Press platform.
Data correspond to usage on the plateform after 2015. The current usage metrics is available 48-96 hours after online publication and is updated daily on week days.
Initial download of the metrics may take a while.