Fig. 4
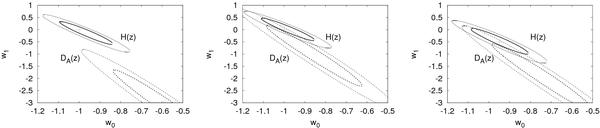
68% and 95% CL for the parameters w0 and w1 inferred from future (mock) observations. Solid lines present the constraints from H(z) data, dotted line from DA(z) data, the cross marks the true value of w0 and w1 used to generate the data. The misalignment of distance-constraints is a result of not taking into account inhomogeneities. Left: the results of analysis within the non-linear Swiss-Cheese model (w0 = −1 and w1 = 0). Middle: the results of analysis within the linear approximation scheme (w0 = −1 and w1 = 0). Right: the results of analysis within the linear approximation scheme (w0 = −0.95 and w1 = −0.5).
Current usage metrics show cumulative count of Article Views (full-text article views including HTML views, PDF and ePub downloads, according to the available data) and Abstracts Views on Vision4Press platform.
Data correspond to usage on the plateform after 2015. The current usage metrics is available 48-96 hours after online publication and is updated daily on week days.
Initial download of the metrics may take a while.