Fig. 2
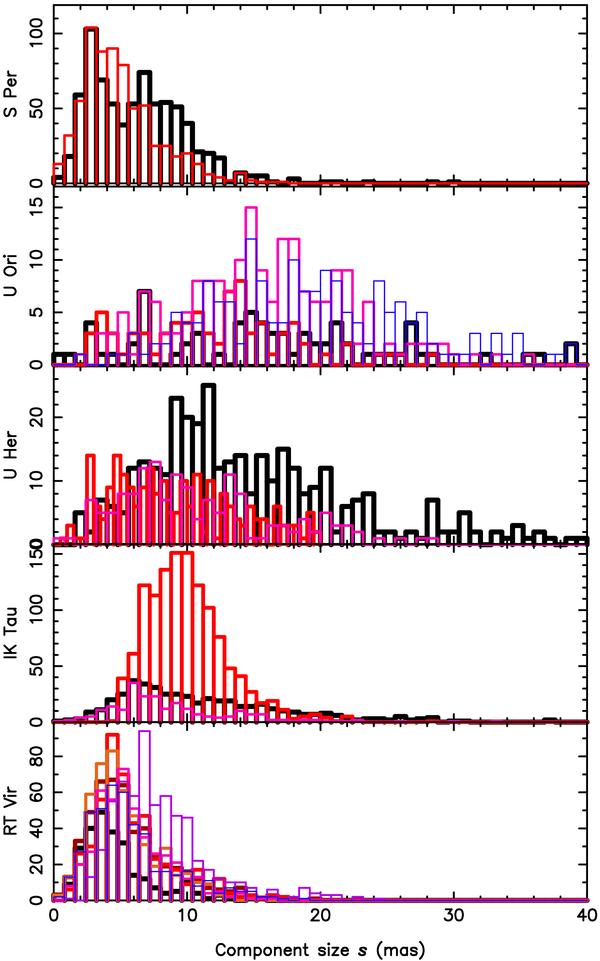
Histogram of the sizes of H2O maser components exceeding the observational error (sυ > σs). The ordinate shows the number of components per size bin. The thickest black line shows the distribution for the epoch with the brightest maximum emission (Imax, given in Table 2) for each star, with thinner and paler/bluer lines representing epochs with progressively fainter maxima. A few U Her and U Ori components with sizes > 40 mas are not shown.
Current usage metrics show cumulative count of Article Views (full-text article views including HTML views, PDF and ePub downloads, according to the available data) and Abstracts Views on Vision4Press platform.
Data correspond to usage on the plateform after 2015. The current usage metrics is available 48-96 hours after online publication and is updated daily on week days.
Initial download of the metrics may take a while.