Fig. 5
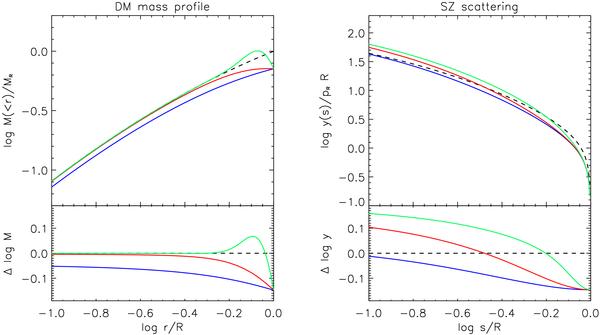
Left: profile of DM mass. The dashed line illustrates the true mass, while the solid lines illustrate what is reconstructed from X-ray observables on assuming pure thermal HE. Right: projected profile of SZ scattering; the dashed line refers to the purely thermal case, while solid lines refer to the turbulent case. In both panels δR = 40% and different values of ℓ (color code as in Fig. 2) are adopted.
Current usage metrics show cumulative count of Article Views (full-text article views including HTML views, PDF and ePub downloads, according to the available data) and Abstracts Views on Vision4Press platform.
Data correspond to usage on the plateform after 2015. The current usage metrics is available 48-96 hours after online publication and is updated daily on week days.
Initial download of the metrics may take a while.