Fig. 4
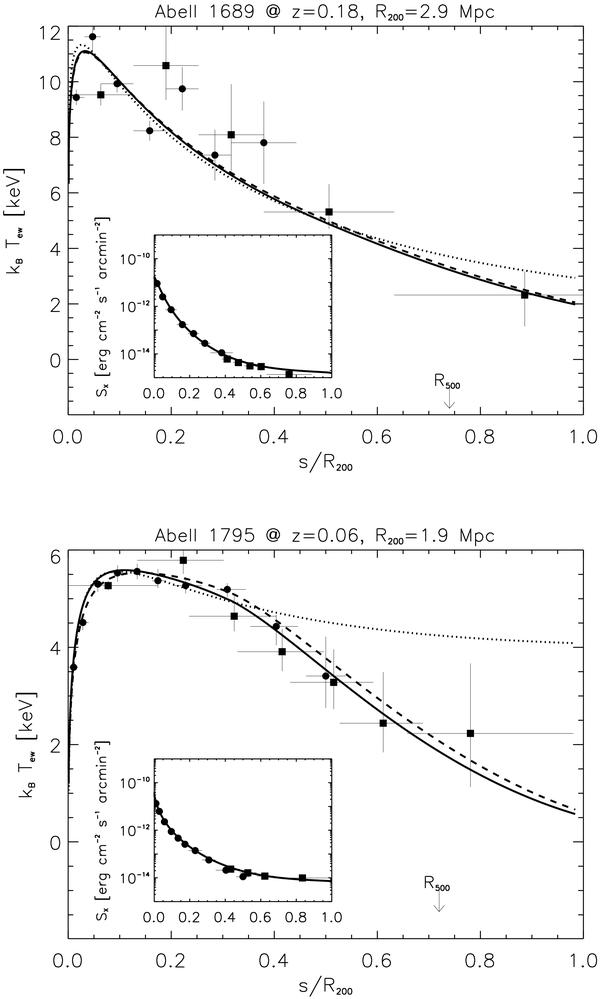
Profiles of projected X-ray temperature (brightness in the insets) for the CC clusters A1689 (top) and A1795 (bottom). Data are from Snowden et al. (2008) with XMM-Newton (circles), and from Bautz et al. (2009) and Kawaharada et al. (2010) with Suzaku (squares). The solid lines represent our best fits with the SM extended to include turbulence after Eqs. (7) and (8) with δR = 40% and ℓ = 0.5 R. The dashed ones illustrate the outcomes in the absence of turbulence, but still with entropy decreasing outwards as in Lapi et al. (2010). For comparison, the dotted lines illustrate the case with an uniform entropy slope.
Current usage metrics show cumulative count of Article Views (full-text article views including HTML views, PDF and ePub downloads, according to the available data) and Abstracts Views on Vision4Press platform.
Data correspond to usage on the plateform after 2015. The current usage metrics is available 48-96 hours after online publication and is updated daily on week days.
Initial download of the metrics may take a while.