Fig. 3
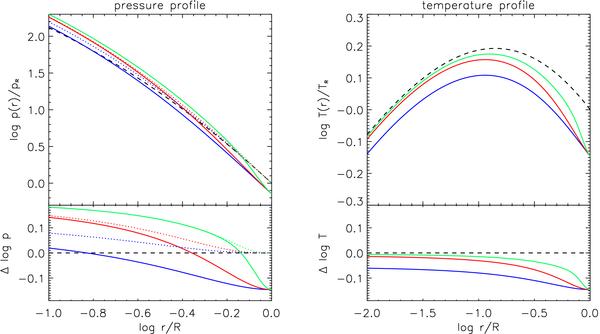
Profiles of pressure and temperature computed with the SM. The dashed line illustrates the pure thermal (laminar) case, while solid lines illustrate the turbulent case with δR = 40% and different ℓ (color code as in Fig. 2). In the left panel, solid lines refer to the thermal pressure, dotted ones to the total pressure.
Current usage metrics show cumulative count of Article Views (full-text article views including HTML views, PDF and ePub downloads, according to the available data) and Abstracts Views on Vision4Press platform.
Data correspond to usage on the plateform after 2015. The current usage metrics is available 48-96 hours after online publication and is updated daily on week days.
Initial download of the metrics may take a while.