Fig. 6
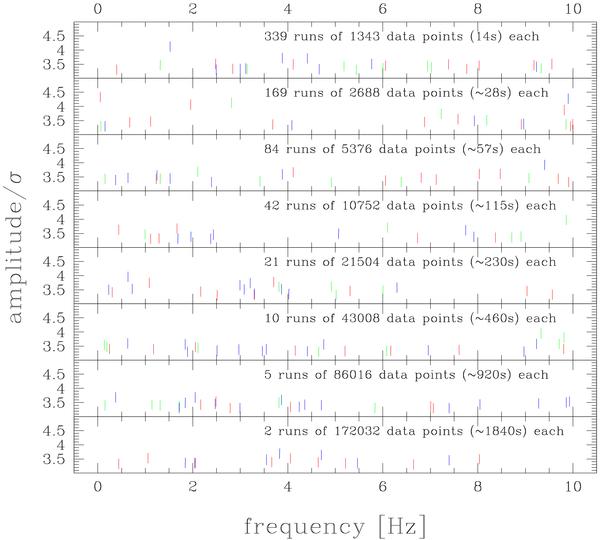
Search for pulsations with life times shorter than the observing runs: each panel shows the peaks with amplitude higher than 3.3σ, detected in n subsets with same length, extracted from the three runs on G 185-32. Note that the detection limit varies from panel to panel as it goes with d − 1 / 2, where d is the duration of each subset. In this plot, the 4σ detection threshold goes from a relative amplitude of ~5 × 10⁻⁴ (lower panel) to about 6 × 10⁻³ (upper panel). Only for the online electronic version, the different colors refer to the different dates of the runs: green = 6 May, red = 7 May, blue = 18 May 2005.
Current usage metrics show cumulative count of Article Views (full-text article views including HTML views, PDF and ePub downloads, according to the available data) and Abstracts Views on Vision4Press platform.
Data correspond to usage on the plateform after 2015. The current usage metrics is available 48-96 hours after online publication and is updated daily on week days.
Initial download of the metrics may take a while.