Fig. 5
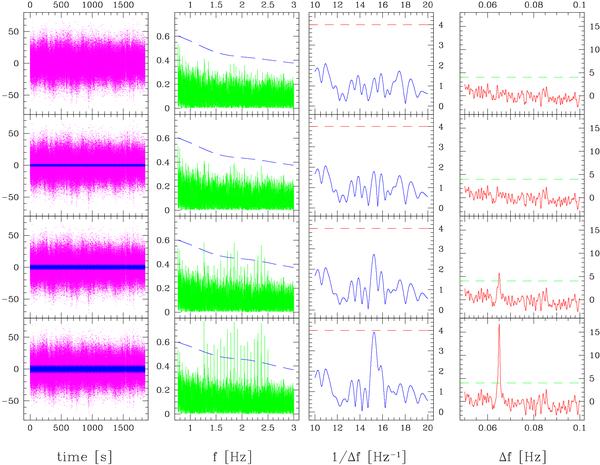
Comparison between G 185-32 (18 May 2005, upper panels) and synthetic data. Each synthetic dataset was constructed by adding to the VLT data a sequence of 20 sinusoidal waves between 1.265 and 2.5 Hz, equally spaced in frequency (Δf = 0.065 Hz). All the 20 sinusoids have same relative amplitude of 2 × 10⁻⁴, 4 × 10⁻⁴ and 6 × 10⁻⁴ respectively. The various columns represent respectively: light curve with synthetic sinusoids superimposed (1), amplitude spectrum (2), amplitude spectrum of the amplitude spectrum or FT2 (3), autocorrelation function of the amplitude spectrum (4). The ordinate is given in relative amplitude × 1000 for Cols. 1 and 2, and in σ units for Cols. 3 and 4. The dashed lines show the 4σ detection threshold, which correspond to 4 times the average noise for Cols. 2 and 3 and to 4 times the standard deviation for Col. 4. In Col. 2 the mean noise was calculated using a (smooth) cubic spline interpolation in order to consider also the noise increase at low frequency due to transparency variations.
Current usage metrics show cumulative count of Article Views (full-text article views including HTML views, PDF and ePub downloads, according to the available data) and Abstracts Views on Vision4Press platform.
Data correspond to usage on the plateform after 2015. The current usage metrics is available 48-96 hours after online publication and is updated daily on week days.
Initial download of the metrics may take a while.