Fig. 4
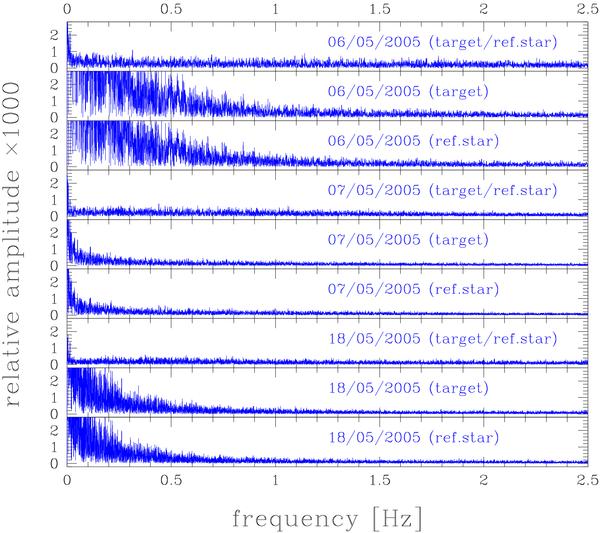
Amplitude spectra of G 185-32 (detail of the low frequency part). The amplitude spectra of the target and reference star alone are also reported. As already seen in Fig. 2, these plots confirm that above about 1 Hz (where transparency variations cease) the mean noise of the amplitude spectrum is lower when we consider the target alone instead of using the flux ratio.
Current usage metrics show cumulative count of Article Views (full-text article views including HTML views, PDF and ePub downloads, according to the available data) and Abstracts Views on Vision4Press platform.
Data correspond to usage on the plateform after 2015. The current usage metrics is available 48-96 hours after online publication and is updated daily on week days.
Initial download of the metrics may take a while.