Fig. 3
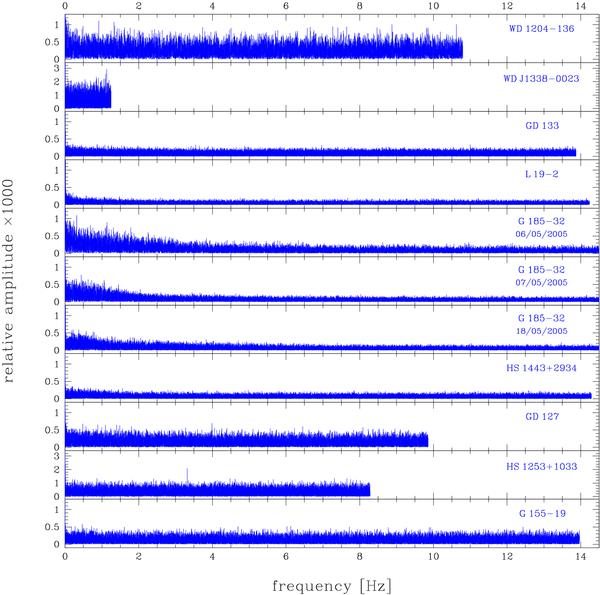
Fourier amplitude spectra of the light curves of Fig. 1. For G 185-32 the high frequency tail, from 14.5 Hz to the Nyquist frequency at about 46.7 Hz, is not shown in this plot and does not contain any significant peak. The ordinate is in relative amplitude × 1000, which is equivalent to milli-modulation amplitude units (mma, 1 mma = 0.1% = 1000 ppm). For two stars, WD 1338-0023 and HS 1253+1033, a different vertical scale has been used. The peak near 3.3 Hz in the spectrum of HS 1253+1033 is a false detection (see text for details).
Current usage metrics show cumulative count of Article Views (full-text article views including HTML views, PDF and ePub downloads, according to the available data) and Abstracts Views on Vision4Press platform.
Data correspond to usage on the plateform after 2015. The current usage metrics is available 48-96 hours after online publication and is updated daily on week days.
Initial download of the metrics may take a while.