Fig. 2
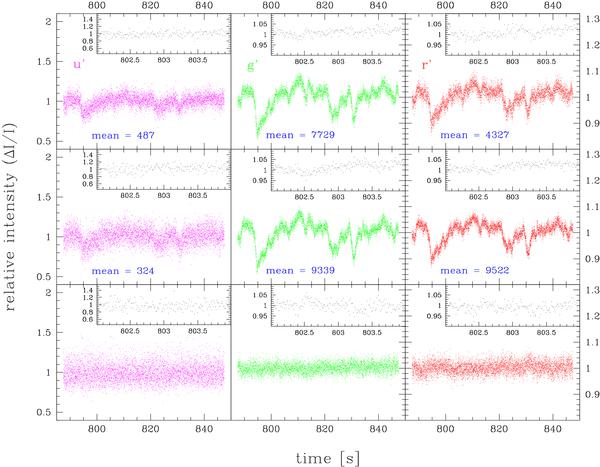
Sky intensity fluctuations on time scales from tenths to tens of seconds (u′, g′ and r′ photometric bands). A section of the light curve of G 185-32 (18 May 2005), with a duration of 1 min, is represented in the upper panels, while the reference star is shown in the central panels. The average counts of each integration (8.8 ms) are reported. The lower panels show the intensity ratio (target’s counts divided by reference star’s counts). This figure shows that on time scales longer than about 1 s it is essential to have a reference star in order to reduce the sky fluctuations. However, for shorter time scales, the light curves of the target and the reference star are not coherent anymore, as we can see from the small panels representing a short section (only 2 s) of the same light curves. Note that the u′ band has a different vertical scale in all panels.
Current usage metrics show cumulative count of Article Views (full-text article views including HTML views, PDF and ePub downloads, according to the available data) and Abstracts Views on Vision4Press platform.
Data correspond to usage on the plateform after 2015. The current usage metrics is available 48-96 hours after online publication and is updated daily on week days.
Initial download of the metrics may take a while.