Fig. 3
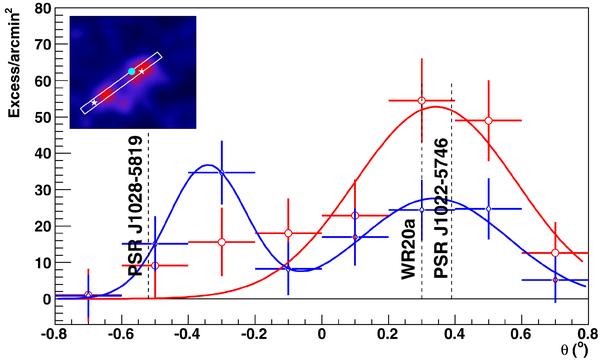
Profile of the TeV emission along the slice defined to contain the maximum of the two γ-ray excesses, as illustrated in the inset. The width of the slice is defined to be twice the HESS angular resolution. The profile on the low energy image is shown in red while the one for the high energy image is shown in blue. The relative positions of WR 20a and the two Fermi LAT pulsars with respect to the center of the slice are indicated by dashed lines.
Current usage metrics show cumulative count of Article Views (full-text article views including HTML views, PDF and ePub downloads, according to the available data) and Abstracts Views on Vision4Press platform.
Data correspond to usage on the plateform after 2015. The current usage metrics is available 48-96 hours after online publication and is updated daily on week days.
Initial download of the metrics may take a while.