Fig. 2
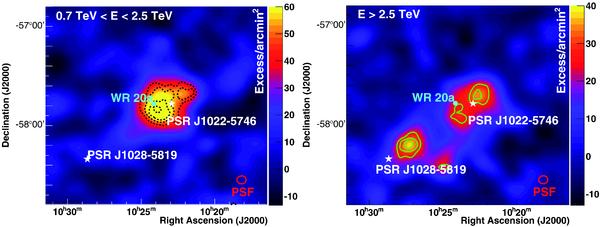
Gaussian-smoothed (σ = 0.08°) excess images for the Westerlund 2/RCW 49 and PSR J1028–5819 region. On the left, the low energy map (0.7 TeV < E < 2.5 TeV) is shown, while the high energy map (E ≥ 2.5 TeV ) is displayed on the right. The HESS significance contours (dashed black lines for the low energy map and solid green ones for the high energy map) are calculated using an oversampling radius of 0.1° and are shown above 4σ in steps of 1σ. The position of WR 20a and the two Fermi LAT pulsars are marked in cyan and white (for more details see text).
Current usage metrics show cumulative count of Article Views (full-text article views including HTML views, PDF and ePub downloads, according to the available data) and Abstracts Views on Vision4Press platform.
Data correspond to usage on the plateform after 2015. The current usage metrics is available 48-96 hours after online publication and is updated daily on week days.
Initial download of the metrics may take a while.