Fig. 1
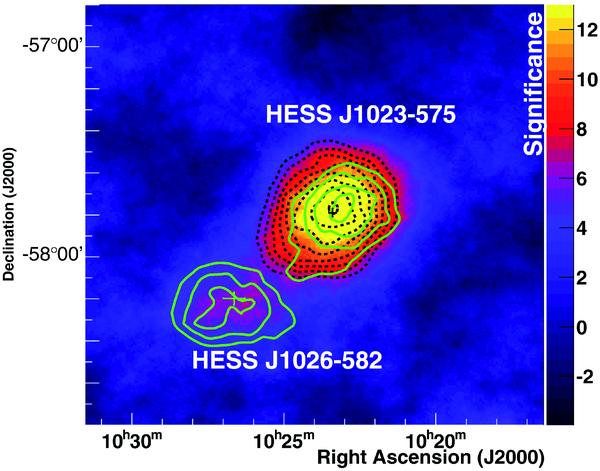
Image of the Westerlund 2 field showing the significance of the VHE γ-ray emission using an oversampling radius of 0.22°. The contours in black (dashed) and green (solid) show the significance levels for the maps at low and high energy range, respectively, using the same oversampling radius, starting at 5σ in steps of 1σ. The maximum of the color scale has been chosen such that the typical detection threshold ~5σ appears on the transition from blue to red.
Current usage metrics show cumulative count of Article Views (full-text article views including HTML views, PDF and ePub downloads, according to the available data) and Abstracts Views on Vision4Press platform.
Data correspond to usage on the plateform after 2015. The current usage metrics is available 48-96 hours after online publication and is updated daily on week days.
Initial download of the metrics may take a while.