Fig. 2
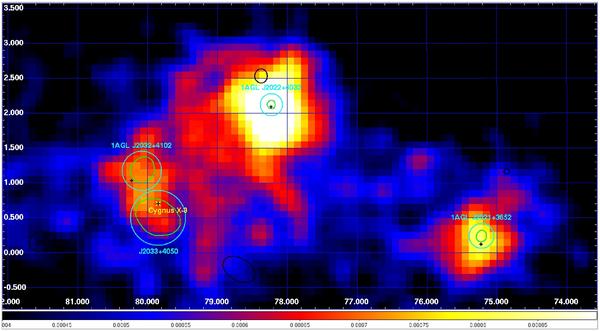
Cygnus region in galactic coordinates, γ-ray intensity map for E ≥ 100 MeV. Deep integration AGILE-GRID data (November 2007–August 2009). Pixel size = 0.1° with 3-pixel Gaussian smoothing. Green contours: AGILE-GRID 95% confidence level. Cyan contours: AGILE-GRID statistical + systematic error (0.1°). Black contours: Fermi-LAT (1-year catalog), statistical error only, crosses shown for contours too small to be visible. The Green contours have been calculated with a multi-source likelihood analysis, using four persistent sources (Table 1).
Current usage metrics show cumulative count of Article Views (full-text article views including HTML views, PDF and ePub downloads, according to the available data) and Abstracts Views on Vision4Press platform.
Data correspond to usage on the plateform after 2015. The current usage metrics is available 48-96 hours after online publication and is updated daily on week days.
Initial download of the metrics may take a while.