Fig. 11
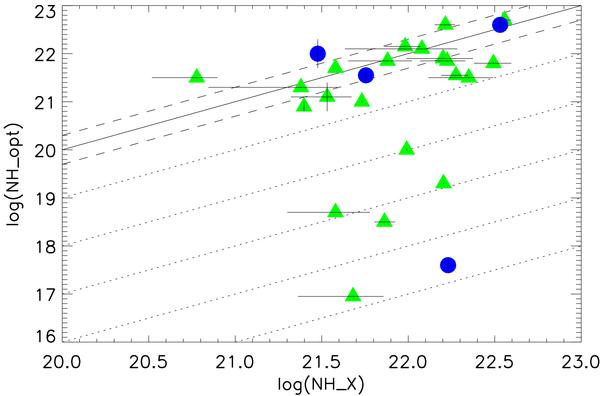
X-ray column densities versus hydrogen column densities obtained from optical spectra. Dashed lines indicate values within a factor of 2 from the line of equal X-ray to optical column density (continuous line). Dotted lines mark optical column densities nth orders of magnitude less than X-ray ones. Each group is identified with the same symbols and colours as in Fig. 1.
Current usage metrics show cumulative count of Article Views (full-text article views including HTML views, PDF and ePub downloads, according to the available data) and Abstracts Views on Vision4Press platform.
Data correspond to usage on the plateform after 2015. The current usage metrics is available 48-96 hours after online publication and is updated daily on week days.
Initial download of the metrics may take a while.